
Page 27 - Payment System Review -Q2 FY24
P. 27
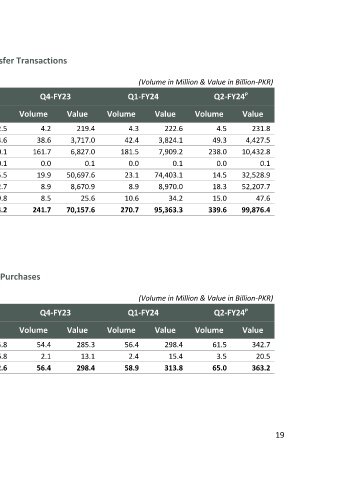
A-5: Funds Transfer Transactions

                                    (Volume in Million & Value in Billion-PKR)
                                                              P
 Q3-FY23   Q4-FY23               Q1-FY24              Q2-FY24
 Transactions through
 Volume   Value   Volume   Value   Volume   Value   Volume   Value
 ATM    4.1     222.5     4.2     219.4     4.3     222.6     4.5     231.8
 Internet Banking    34.1     3,243.6     38.6     3,717.0     42.4     3,824.1     49.3     4,427.5
 Mobile Phone Banking    147.2     6,240.1     161.7     6,827.0     181.5     7,909.2     238.0     10,432.8
 Call Center /IVR Banking    0.0     0.1     0.0     0.1     0.0     0.1     0.0     0.1
 Bank Branch (intra-bank)*    26.5     45,635.5     19.9     50,697.6     23.1     74,403.1     14.5     32,528.9
 Bank Branch (inter-bank)**    7.8     7,682.7     8.9     8,670.9     8.9     8,970.0     18.3     52,207.7
 E-Wallet    6.5     19.8     8.5     25.6     10.6     34.2     15.0     47.6
 Total Funds Transfer    226.2     63,044.2     241.7     70,157.6     270.7     95,363.3     339.6     99,876.4
 * Transfers within same bank through Real-time-Online Branches (RTOB)
 ** Transfers between different banks or financial institutions
 P: Provisional | R: Revised


 A-6: POS Purchases


                                    (Volume in Million & Value in Billion-PKR)
                                                              P
 Q3-FY23   Q4-FY23               Q1-FY24              Q2-FY24
 Transactions through
 Volume   Value   Volume   Value   Volume   Value   Volume   Value
 Domestic issued Cards    48.8     255.8     54.4     285.3     56.4     298.4     61.5     342.7
 Foreign issued Cards    2.7     16.8     2.1     13.1     2.4     15.4     3.5     20.5
 Total POS Purchases    51.6     272.6     56.4     298.4     58.9     313.8     65.0     363.2
 P: Provisional | R: Revised


                                                                     19