
Page 24 - Payment System Review -Q2 FY24
P. 24
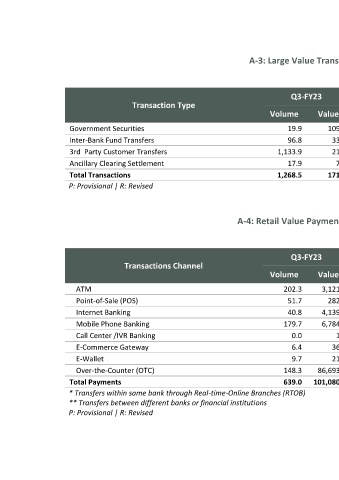
A-3: Large Value Transactions (PRISM – RTGS)

                                                                                                                    (Volume in thousands & Value in Trillion-PKR)
                                                                                                                                                  P
                                                                         Q3-FY23               Q4-FY23               Q1-FY24              Q2-FY24
                                  Transaction Type
                                                                    Volume      Value     Volume      Value     Volume      Value     Volume     Value
                  Government Securities                                  19.9      109.2       18.8      118.4      19.0       133.9       25.3     191.0
                  Inter-Bank Fund Transfers                              96.8       33.2       89.9       37.8      91.5        42.2       97.7      53.6
                  3rd  Party Customer Transfers                        1,133.9      21.9     1,116.5      20.7    1,312.6       23.2     1,351.4     25.2
                  Ancillary Clearing Settlement                          17.9        7.2       14.1        6.1         -          -         6.7       2.9
                  Total Transactions                                  1,268.5      171.5     1,239.3     183.1     1,423.1     199.3     1,481.1     272.7
                  P: Provisional | R: Revised


                                                            A-4: Retail Value Payments (Banks, MFBs and EMIs)

                                                                                                                        (Volume in Million & Value in Billion-PKR)
                                                                                                                                                  P
                                                                         Q3-FY23               Q4-FY23               Q1-FY24              Q2-FY24
                                Transactions Channel
                                                                    Volume      Value     Volume      Value     Volume      Value     Volume     Value
                    ATM                                                 202.3     3,121.0     220.0     3,409.3     214.1     3,289.8     235.0     3,709.2
                    Point-of-Sale (POS)                                  51.7      282.7       56.6      307.5       59.0      321.9       65.1     371.4
                    Internet Banking                                     40.8     4,139.8      45.6     4,567.6      49.8     4,666.1      57.1     5,369.3
                    Mobile Phone Banking                                179.7     6,784.0     195.7     7,459.1     217.4     8,644.9     279.9     11,226.2
                    Call Center /IVR Banking                              0.0        1.9        0.0        1.9        0.0        2.0        0.0       1.9
                    E-Commerce Gateway                                    6.4       36.6        8.2       37.7        9.6       39.6       10.9      50.5
                    E-Wallet                                              9.7       21.3       12.7       29.7       15.4       37.0       20.1      50.8
                    Over-the-Counter (OTC)                              148.3     86,693.3     135.0     93,607.4     142.3    117,573.2     148.2    119,546.7
                  Total Payments                                        639.0    101,080.6     673.8    109,420.2     707.6    134,574.4     816.3    140,325.8
                  * Transfers within same bank through Real-time-Online Branches (RTOB)
                  ** Transfers between different banks or financial institutions
                  P: Provisional | R: Revised


                                                                                                                                                          18