Deposit growth slowed down to 8.8 percent in FY18 from 12.4 percent a year earlier. However, it is important to note that over 44.8 percent of the deposit increase during FY18 came in a single month – June; excluding this month, the slowdown in deposit growth is much sharper (see Figure 3.1.1). A common explanation is the presence of very low interest rates, which has created a disincentive for depositors to place their funds with banks. Moreover, since overall M2 growth has decelerated, a slowdown in deposits also seems logical.
However, in previous cycles of accommodative monetary policy, the growth in bank deposits had remained intact. Importantly, deposits to M2 ratio at end-June 2018 represents one of the lowest levels since the initiation of reforms in the early 1990s (Figure 3.1.2). This indicates that the newly created money for general public and businesses is not re-entering the banking system. This has several disadvantages, including but not limited to, negative effects on economic growth and lower liquidity with banks to carry out financial intermediation.
Businesses took the major hit
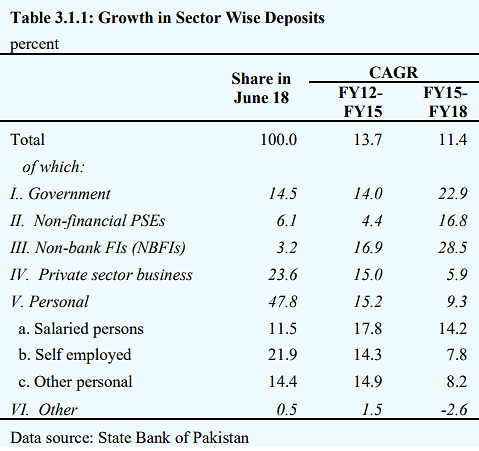
The deposits of the banking system (including government deposits) grew by 13.7 percent in terms of compounded annual growth rate during FY12-FY15; the CAGR then declined to 11.4 percent during FY15-FY18 (see Table 3.1.1). Self-employed (i.e., small businesses) and ‘other personal’ deposits (excluding those of salaried persons) have the biggest share in deposits (36.3 percent by June 2018), and the growth in these deposits almost halved during FY15-FY18 as compared to FY12-FY15. With about a quarter share in total deposits, deposit placement by manufacturing, real estate, commerce and trade firms has also been lukewarm.

Withholding tax regime continues to hurt
The foremost reason that triggered the reversal of trend in deposits to M2 ratio a couple of years ago was the imposition of withholding tax on non-cash banking transactions (exceeding Rs 50,000) for non-filers, which went into effect from July 2015 (see Special Section 1 of SBP’s Annual Report 2017 for details). Though the general perception is that bank deposits subsequently recovered in FY17 and FY18, data shows otherwise. The deposit-to-M2 ratio has continued to slide during FY17 and FY18, which indicates that the impact of withholding tax is still hindering the movement of cash back into the banking system.
Banks’ own strategy to avoid remunerative deposits
Banks’ efforts to mobilize deposits from the private sector have been weak in recent years, especially for remunerative deposits. This behavior can be traced to the imposition of floor on deposit rates that limits banks’ ability to cut their interest expenses. Anecdotal evidence suggests that bankers have been encouraging new customers to open current or savings accounts, instead of fixed/term deposits. A balance sheet review of a selective pool of banks also shows that adjusting deposit portfolios is a common strategy to minimize interest expenses. In fact, many banks have boasted in their annual and quarterly statements of “taper off”, “shed”, or “optimize” their high-cost deposits. Mobilization of low-cost current and savings account (CASA) deposits seems to be rampant amongst banks in hopes of keeping them profitable. Therefore, it is not surprising that the impact on term deposits (21.0 percent share) has been most severe (Figure 3.1.3).
Availability of alternative sources of bank liquidity
Ample availability of liquidity is another factor that has undermined banks’ deposit-taking efforts in recent years. First, OMO injections by SBP (to keep the overnight rate close to the target rate) have been quite helpful for banks in meeting their liquidity needs. Over the previous 3 years, the average volume of OMO injections has been similar to the increase in banks’ deposit base (Figure 3.1.4).
Similarly, SBP’s refinance schemes – that have attracted borrowers due to subsidized mark-ups – have been a source of liquidity for commercial banks, especially for long-term funding. Over the last 3 years, banks received refinance from SBP against around 12 percent of total business loans.
Last but not least, public sector deposits (government as well as public sector enterprises) have emerged as an important source of bank liquidity. Over the last 3 years, these deposits have contributed, on average, 30 percent of the total increase in bank deposits. In outstanding stock of deposits, the share of the public sector has touched 20 percent by end-FY18, up from 16 percent 3 years earlier. Banks have been relying increasingly on these deposits to meet their operational requirements.
Measures should be taken to encourage savers to place their funds with banks.In this regard, while SBP has repeatedly advised banks to increase their deposits taking efforts and has also put in place floors on deposit rates, it is extremely important to reconsider the taxation regime. The removal of withholding tax on non-cash transactions will be particularly helpful. Importantly also, it is expected that with a reversal in monetary policy stance, liquidity dynamics may change in the interbank and this could induce banks to focus more on expanding the deposit base.