Financial Stability Review 2018

Governors Message
The year 2018 remained quite eventful from both global
and domestic perspectives. The global economic momentum softened, amid increasing
trade tensions and tightening financial conditions. The domestic economy faced
various idiosyncratic challenges. The country had to go through uncertainties
associated with the political transition in the first half. Afterwards, the
widening twin deficits and elevated inflationary pressures necessitated policy
measures for stabilization, which, as expected, slowed down the economic momentum.
Resultantly, the investors sentiments remained subdued and financial markets,
particularly the foreign exchange and equity markets, observed increased volatility.
In response to the market dynamics, the local currency depreciated and the
KSE-100 index dipped. The money market, however, operated smoothly by virtue
of the interest rate corridor mechanism and improved liquidity conditions.
Amid these challenges, the financial institutions,
however, remained sound and facilitated the improvement in financial intermediation.
Banks, the key player in the financial sector, carried forward the rising
momentum in total loans with 22 percent growth, while maintaining strong solvency
and liquidity profiles. Their capital adequacy ratio at 16.2 percent stood
well above the international benchmark and the non- performing loans ratio
decreased to 8 percent, despite some increase in NPLs during 2018. Moreover,
the financial inclusion broadened due to joint efforts of the SBP and its
regulated financial institutions. Particularly, to pursue the National Financial
Inclusion Strategy, SBP introduced policy measures to enhance financial access
to priority areas of SME, Housing and Agriculture, and to promote cross cutting
themes of Islamic Banking and Digital Financial Services.
State Bank, in line with its strategic objective
of ensuring financial system stability, under Vision 2020, is closely monitoring
global and domestic developments and responding appropriately where necessary.
The current Financial Stability Review provides a detailed assessment of the
emerging risks and highlights measures taken to beef up the financial sector
stability. Among the emerging challenges, SBP stepped up its efforts to strengthen
the overall AML/CFT regime and fortified the cyber resilience. In addition,
SBP progressed towards Macro-Prudential Policy Framework by introducing regulatory
guidelines for the designation of Domestic Systemically Important Banks (DSIBs),
improving coordination among financial sector regulators and stepping up efforts
for the establishment of an overarching National Financial Stability Council
(NFSC).
I hope that the stakeholders would find this report
helpful and informative. Any suggestions, comments and feedback are welcome.
Dr. Reza Baqir
The Financial Stability Review (FSR) team is highly
indebted to Mr. Tariq Bajwa, Ex-Governor and Dr. Reza Baqir, Governor, State
Bank of Pakistan (SBP) for their encouragement and guidance. The team is also
grateful to members of Publications Review Committee (PRC) of the Management
for providing invaluable feedback on the report. We are also thankful to Mr.
Jameel Ahmad, Deputy Governor (Banking and FMRM) and Dr. Inayat Hussain, Executive
Director, Banking Supervision Group, for their continuous support and supervision
in the preparation of this report.
The team would also like to thank various departments
of SBP, especially Research Department (RD), Banking Policy and Regulations
Department (BPRD), Offsite Supervision & Enforcement Department (OSED),
Exchange Policy Department (EPD), Agricultural Credit & Microfinance Department
(AC&MFD), Domestic Markets and Monetary Management Department (DMMD),
Islamic Banking Department (IBD), Monetary Policy Department (MPD), Payment
Systems Department (PSD) and Statistics and Data Warehouse Department (S&DWHD)
for their valuable support and feedback.
We are also grateful to the Securities & Exchange
Commission of Pakistan (SECP), National Clearing Company of Pakistan (NCCPL),
Mutual Funds Association of Pakistan (MUFAP) and Pakistan Stock Exchange (PSX)
for providing relevant data, technical information and comments on the relevant
chapters/sections of the report.
Dr. Saeed Ahmed (Chairman)
Dr. Inayat Hussain
Syed Irfan Ali
Syed Samar Hasnain
Mr. Muhammad Ali Malik
Mr. Ali Choudhary
Dr. M. Farooq Arby
Dr. Omar Farooq Saqib
Dr. Azizullah Khattak
Mr. Muhammad Javaid Ismail
Team Leaders
Muhammad Javaid Ismail, Director Financial Stability
Department
Dr. Asif Ali, Additional Director Financial Stability
Department
Team Members
Amer Hassan
Anum Naeem
Aqeel Ahmed
Dr. Jameel Ahmed
Faraz Karim
Farzand Ali
Haris Ali
Hassaan Zafar
Mariam Abbas
Mohammad Abdul Rehman Ansari
Muhammad Sadiq Ansari
Qaisar Mehmood
Shahzad Ahmad
Waseem Abbas
Wasif Hussain
Feedback and Queries: [email protected]
The FSR 2018 uses CY for the Calendar Year, FY for
the Fiscal Year (starting in July of a CY and ending in June of the following
CY), Q1-Q4 for the four quarters of the corresponding CY or FY and H1-H2 for
the two halves of a CY or FY, as the case may be.
The review is, generally, based on the data reported
in the unaudited or audited accounts (where available) of financial institutions
for different components as follows:
-
Banks (conventional and Islamic), Development Finance Institutions (DFIs), Microfinance Banks (MFBs) and Payment System are based on un-audited financial statements reported to SBP through Quarterly Reporting Chart of Accounts (RCOA) and various other returns.
-
Data on Non-Bank Financial Institutions (NBFIs) is based on monthly reports submitted to SECP through Specialized Companies Return System (SCRS).
-
Insurance is based on audited and un-audited financial statements for the year ending December 31, 2018.
The data pertaining to corporate sector has been obtained
from the financial statements of companies, SECP, SBP, PSX and Bloomberg.
Introduction:
CY18 has been challenging for the financial sector
of Pakistan. The rise in macroeconomic vulnerabilities on external and fiscal
fronts necessitated stabilization measures that led to a slowdown in the pace
of domestic economic growth. The financial markets have remained volatile
and have, generally, trended downwards. However, financial institutions and
market infrastructure have largely remained resilient and performed steadily
during the year.
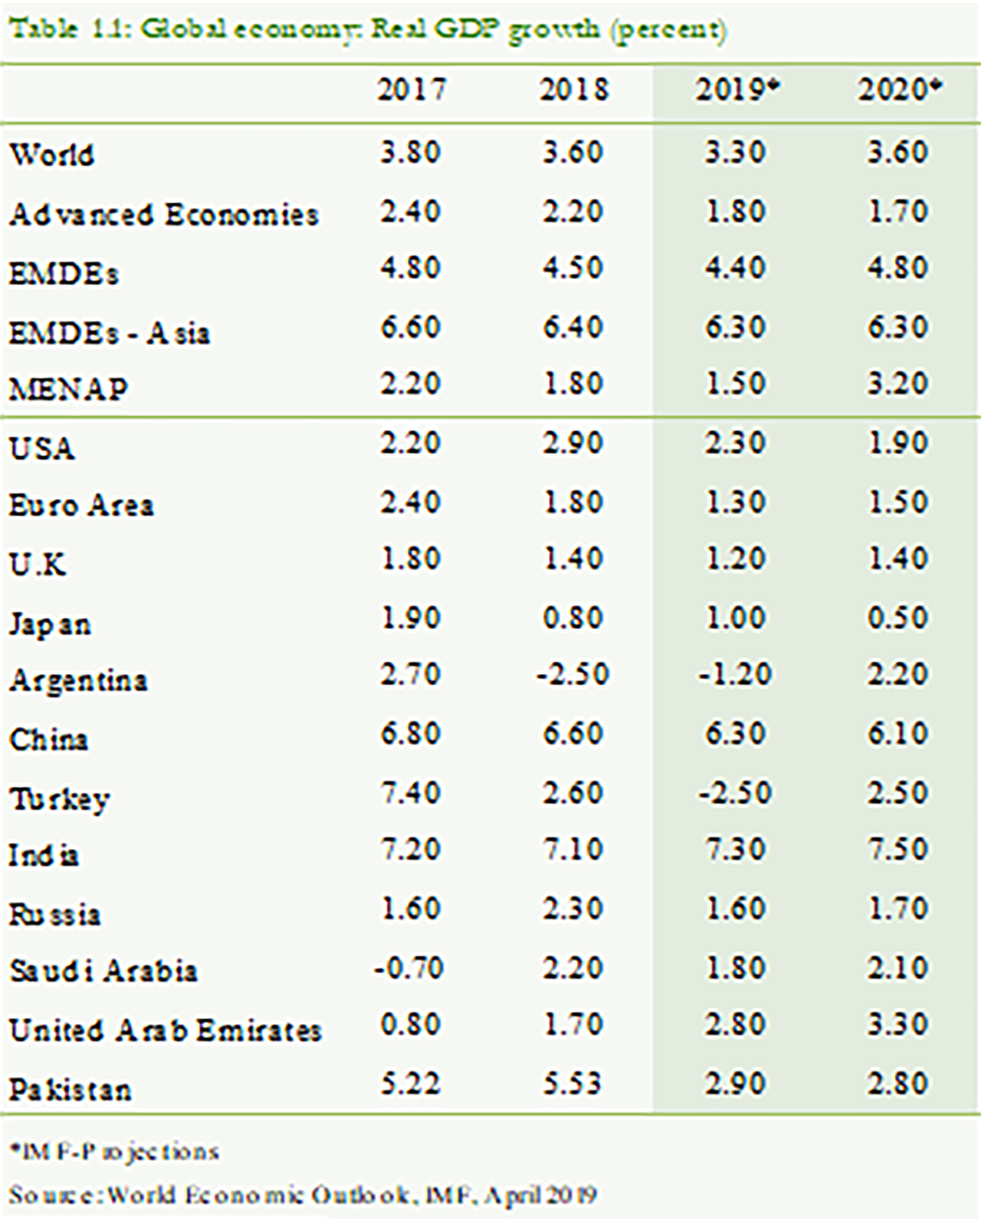
On the global front, the economic growth has moderated
to 3.6 percent in CY18, after peaking at 3.8 percent a year earlier. This
growth is also not broad based as 52 percent of the economies posted growth
in CY18 as against 57 percent of the economies a year earlier. The limitations
of fiscal and monetary policies to respond to growing challenges, especially
the rising trade tensions and geopolitical risks, increased the uncertainty
in the global economy. These uncertainties coupled with Fed rate hikes affected
the investors sentiments, which led to capital outflows from EMDEs, including
Pakistan. The policy measures adopted by EMDEs in response to these challenges
have constrained the economic growth. Though the Feds announcement to adopt
more accommodative monetary policy has allayed some of the concerns, global
economic prospects in the short term have been less than favorable and the
global economy is expected to further slowdown in 2019 (See Chapter 1).
[1]
The domestic economic developments during CY18, though
idiosyncratic in nature, influenced the performance and risk profile of the
financial system. The macroeconomic vulnerabilities, which started to emerge
in CY17, have further intensified in CY18. The rising twin deficits and elevated
inflationary pressures have necessitated the adoption of economic stabilization
agenda. The consequent measures like monetary tightening, exchange rate adjustments,
and fiscal consolidation have affected the economic momentum. After posting
a decade high growth of 5.53 percent during FY18, the economic growth has
tapered off to 3.29 percent in FY19.
[2]
The Large Scale Manufacturing (LSM) has also contracted by 3.64
percent during FY19,
[3]
while the annual average inflation has also jumped
to 7.3 percent during FY19.
[4]
Shrinking current account deficit remains the key improvement that
has come at the back of various regulatory measures and an increase in the
level of workers remittances (See Chapter 1).
The tightening domestic financial conditions along
with rising uncertainty among the market participants have put the financial
markets under stress.
[5]
The bearish trend in the equity markets has accentuated risk-averse
sentiments and flight to safety as the investors have preferred money market
and fixed income funds over stocks. In addition, the financial institutions
have tilted their investments in government securities towards short-end of
the maturity structure i.e. MTBs and retired long-term PIBs on net basis to
avoid any mark-to-market losses. This strategy has led to a decline in the level
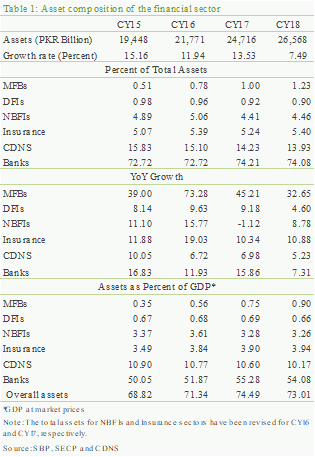
of outstanding investments during CY18. Accordingly, the growth of the financial
sector has moderated to 7.49 percent in CY18, and the financial depth, as
measured by financial assets to GDP ratio, has moderated to 73.01 percent (Table
1).
In CY18, the operations and risk profile
of the domestic financial markets have been largely influenced by the
growing external account vulnerabilities, tighter monetary policy response,
and uncertainty among the market participants. While Government has succeeded
in raising sizeable bilateral financial support, these flows could partially
finance the high current account deficit. As a result, the SBP FX reserves depleted
by around USD 7 billion and the PKR, cumulatively, depreciated by 23.61 percent
against US dollar, leading to higher volatility in the FX market. Besides, uncertainties
associated with the political transition and future economic direction led to
bearish sentiments in equity market that pulled down the KSE-100 index by 7.58
percent (on average) during the year. However, volatility in the money market
has remained contained due to interest rate corridor mechanism in place and
prudent management of market liquidity by SBP (See
Chapter 2).
Banking sector, the backbone of the financial
sector, has generally weathered the challenging macro-financial conditions
and performed steadily. The financing growth has increased, profitability
remains reasonable, liquidity buffers stayed high, and solvency of the banking
sector has remained adequate (See Chapter 3.1).
The financial intermediation has improved with advances
to deposit ratio attaining its highest level of 55.81 percent in the last
eight years. The high financing growth in the private sector has mainly supported
this improvement in intermediation. The demand for financing has mainly come
from textile, food and beverage, cement, energy, chemical and real estate
sectors. The rise in input costs, as reflected in almost 33.29 percent growth
in the working capital loans, is partially responsible for the surge in demand.
The funds generated through deposit mobilization coupled with net-retirement
of investment in government securities enabled the banks to meet the increase
in credit requirements.
The credit to private sector can get further thrust
if the banking sectors exposure to government could be reduced.
[6]
Though, it is encouraging to note that the trend of rising credit
to government has reversed in CY18, the exposure still remains high at 48.15
percent of the assets, with one-sixth of it lent to the public sector power
entities and commodity finance operations. As the share of financing to these
sectors is continuously growing, it is imperative to resolve the underlying
structural issues related to energy sector circular debt and otherwise self-liquidating
commodity operations.
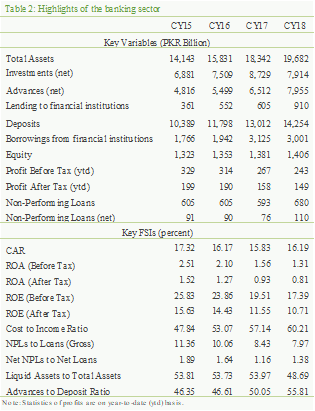
Asset quality of the banking sector presents a mixed picture. A higher growth in advances has led to a decline in infection ratio, though the quantum of NPLs has increased during the year. The flow of fresh NPLs is mainly observed in sugar, energy and agriculture sectors domestically along with some impairment in the overseas portfolio in the Middle East region. Accordingly, Net NPLs and capital impairment ratios have observed some rise during the year. [7] (Table 2)
The deceleration in deposits, observed over the last
couple of years, continues during CY18. Deposits have witnessed a growth of
9.55 percent compared to last five years average of 12.26 percent. The slowdown
is mainly driven by: a) strategy of the banks to focus on low cost deposits
in a rising interest rate environment; b) scaling back of operations by few
banks in the overseas markets; c) probable effect of withholding tax on banking
transactions; d) enhanced KYC requirements for depositors; e) increasing placement
of retail deposits in government securities through non-competitive bids;
and f) liquidity generated through net retirement of investments. Among these
factors, compliance with enhanced KYC is necessary to avoid ML/FT risks, while
others like imposition of withholding tax needs appropriate policy tweaking
for effectively pursuing the financial inclusion agenda and enhancing the
banks ability to improve intermediation.
[8]
The banks have posted reasonable profit during CY18,
though increase in provisioning charges against NPLs coupled with a rise in
administrative expenses and one-off extraordinary pension expense have kept
the profitability below the last years level. Encouragingly, a healthy growth
in advances has increased the share of interest income from core financing
activity. Consequently, the net interest margin (NIM) has improved that has
been falling for the last 3 years.
The solvency of the banking sector remains strong
with capital adequacy ratio (CAR) at 16.2 percent well above the minimum
regulatory requirement of 11.9 percent.
[9]
(Table 2). Further, to address the possible systemic risk
posed by the large institutions, SBP has issued a framework for designation
of Domestic Systemically Important Banks (D-SIBs).
[10]
Under the framework, three banks have been designated
as D-SIBs that are subject to enhanced supervision; including the Higher Loss
Absorbency Capital surcharge in the form of additional common equity tier-1
capital (CET1).
[11]
Islamic Banking Institutions have maintained
the fast growth over the years, and, as of end CY18, constitute almost 13.51
percent of the total banking sector assets. The growth in IBIs is mainly driven
by financing activity, while healthy increase in Mudarabah based deposits
provided the required funding. Among the Islamic financing categories, profit
and loss sharing modes of Musharaka and Diminishing Musharaka have gained
prominence with 53 percent share in financing. While IBIs have lent to diverse
economic sectors, their share in financing to SMEs and Agriculture sector
still remains small. As such, IBIs needs to make efforts to explore these
potential financing avenues (See Chapter 3.2).
IBIs have remained sound, with improved asset quality,
higher profitability and CAR well above the minimum requirement. However,
the sector continues to face the dearth of long-term Shariah compliant investment
avenues that limits IBIs ability to effectively manage their liquidity. It
is also affecting the deposit mobilization efforts of IBIs necessary for maintaining
growth trajectory.
Challenging macro environment coupled with increased
volatility in financial markets have particularly increased the risk aversion
in Non-Bank Financial Institutions (NBFIs) directly linked with equity
market. The mutual fundsthe dominant segment of NBFIhave witnessed
both contraction in assets under management as well as a flight to safety
i.e. movement from equity stocks to money market funds. On the other hand,
Investment Finance Companies (IFCs) and Non-Bank Microfinance Companies
(NBMFCs) that are engaged in intermediation function have observed asset
growth and exhibited relatively better performance. The improved availability
of market-based funding has also facilitated the growth of NBMFCs during the
year under review (See Chapter 4.2). Nevertheless, NBFIs continue to
face various challenges that are hindering their growth. Particularly, the
stiff competition from banks is limiting their ability to mobilize low cost
funds and attract quality human resources. Development of an industry level
strategy is needed to address the issues in order to enable the NBFIs to play
an effective role in financial deepening.
The Development Finance Institutions remains
well capitalized; though, they continue to operate with limited suite of financing
products. Particularly, the role of the DFIs in their key area of project
financing remains less than encouraging due to lack of affordable long term
funds. However, the renewed interest in SME financing during CY18 is a positive
development. The DFIs need to make concerted efforts to raise long-term funding
by exploring alternate resource mobilization avenues such as capital market
(See Chapter 4.1).
The asset base of the Insurance sector has
expanded by 10.88 percent in CY18, funded in part by 9.45 percent increase
in gross premiums. However, the profitability indictors for the sector have
slid down slightly owing to increase in net claims. Further, the concentration
remains a concern as the public sector insurers dominate the insurance industry.
Some non-life insurers are also facing solvency issues. These insurers need
to work on viable recovery plans or pursue possible consolidation avenues.
Nevertheless, the low insurance penetration in the country provides an opportunity
for the sector to grow (See Chapter 4.3).
Due to their peculiar business model of dealing in
foreign currencies, the Exchange Companies (ECs) have benefited from
the exchange rate dynamics. However, the operational risk, especially relating
to AML/CFT, remains tangible for these companies. To address these concerns,
SBP has further strengthened the regulatory regime for ECs during the year
under review (See Chapter 4.4).
Financial Market Infrastructure (FMI) remains
resilient and continues to perform efficiently without any major disruption.
Pakistan Real-time Inter-bank Settlement Mechanism (PRISM) has settled a higher
volume and value of large-value transactions, whereas the retail-value segment
has also registered an uptrend. The increasing adoption of electronic modes
for payment indicates growing consumers trust in use of digital financial
services. Furthermore, access of the PRISM allowed to retail customers and
corporate securities settlement institutions
[12]
has infused efficiency in high-value retail settlements and operations
of the markets (See Chapter 6).
The integration between FMIs has also increased the
level of interconnectedness, which involves the element of contagion risk.
Coupled with this, the cyber-security risk poses additional challenges to
these FMIs, with retail payment segment being more vulnerable to the latter
risk category. To safeguard against these emerging threats, SBP has taken
various measures to protect the integrity of the FMIs. Particularly, a comprehensive
set of instructions has been issued to ensure security of digital payments.
Moreover, the National Clearing Company Limited (NCCPL) and Central Depository
Company (CDC), which constitute the corporate securities settlement infrastructure,
have also strengthened their risk management practices.
To guard against the cyber security risk, banks have
also fortified mitigation measures. Most of the banks have implemented multifactor
authentication to strengthen the security of internet banking transactions,
whereas they continue to work on strengthening their intrusion detection and
prevention systems to protect their IT infrastructure from cyber-attacks.
Furthermore, in compliance with SBPs regulations, banks have been issuing
payment cards with Euro-MasterCard-Visa (EMV) anti-skimming standards.
Financial inclusion in the country is accelerating
due to increased access to quality financial services to a wider stratum of
the population. Especially, the branchless banking and m-wallet accounts have
remained the key drivers in enabling the financial access to the underserved
areas of the country. Microfinance banks, an important element of National
Financial Inclusion Strategy (NFIS), continue to perform well with improved
resilience. At present, growing financial inclusion poses minimal concerns
to financial stability due to lower inclusion base, risk based due diligence
of customers, and comprehensive regulatory and supervisory framework in place
(See Chapter 7).
The performance of non-financial corporate sector
has moderated as reflected in the slackness of its operational
efficiency and financial standing in CY18. The leverage of the sector has
inched up, whereas liquidity, debt repayment capacity and profitability have
slightly declined. The investors perception about the corporate sector has
also weakened as illustrated by a drop in stock prices and other leading market
indicators. Positively, the rating culture in the corporate sector is on the
rise. The phased decline in corporate tax rate as proposed in the interim
fiscal budget is likely to augment profitability of the corporate sector (See
Chapter 5).
Anti Money Laundering/Countering Financing of Terrorism
(AML/CFT) is another key area where local regulatory bodies are making continuous
efforts to safeguard the financial system against ML/FT risk. Though Pakistan
has recently been identified as a jurisdiction with strategic AML/ CFT deficiencies,
it has made a high-level political commitment to implement the action plan
for overcoming the identified gaps. To this end, a number of measures have
been introduced that demonstrates the seriousness of the country to ensure
a robust AML/CFT regime. Key regulatory initiatives include a)- establishment
of dedicated CFT desk in banks, b)- ensuring biometric verification of 100
percent portfolio, c)- issuance of guidance to bring more clarity on the regulatory
expectations in the areas of consumer due diligence, corresponding banking,
wire transfer, compliance with UNSC sanctions, definitions of beneficial owner
and legal entity, counter measures for high-risk countries, etc., d) strengthening
of regulations for NBFCs including adoption of risk-based approach, e) extension
of regulatory regime to cover Designated Non-Financial Business & Professions,
NGOs, Pakistan Post, etc. and f) amendment in the Protection of Economic Reform
Act to strengthen the regime around foreign currency accounts and movement
of foreign currency (See Box-4).
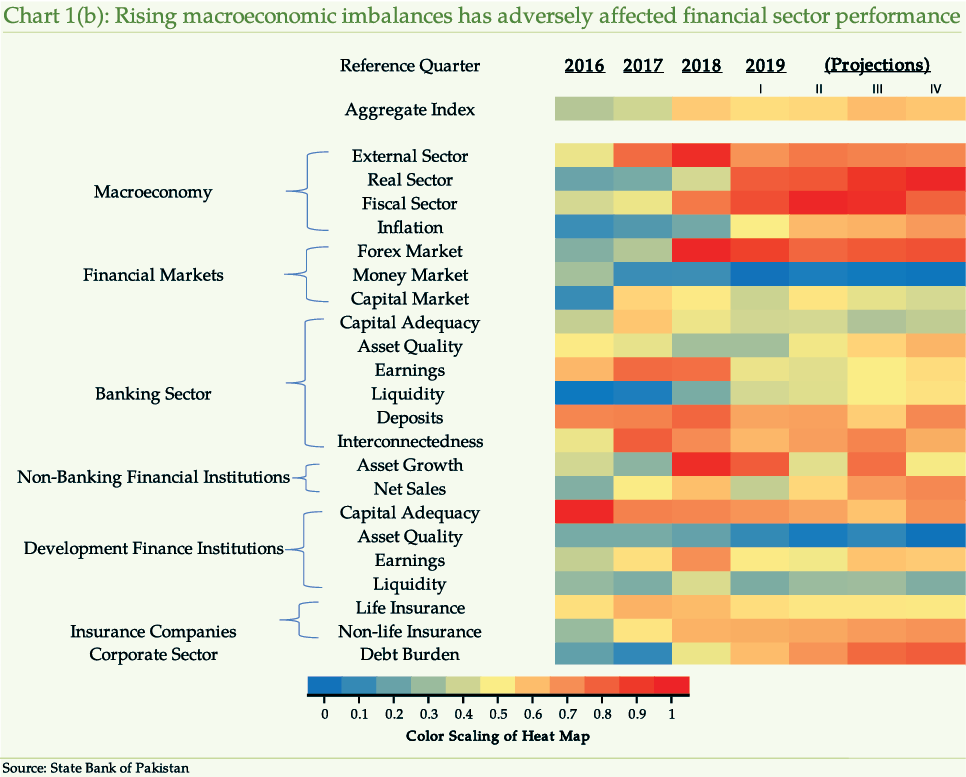
The consolidated picture thus reveals that, amid rising
macro-financial challenges, risks to financial stability have somewhat increased
during CY18 (Chart 1a) (Chart 1b).
.png)
Financial Sector Outlook
Post CY18, the macroeconomic imbalances, particularly
the fiscal deficit, have widened. The current account deficit, though narrowing
gradually, remains at elevated level putting pressure on foreign exchange
reserves. SBP has raised the policy rate by 325 bps post CY18 (until July
2019) to address these macroeconomic challenges. In the near future, the necessary
policy measures for the stabilization of the economy such as rationalization
of taxes in the budget FY19-20 and adjustment in utility prices may further
slowdown the pace of economic wheel. The real GDP is expected to rise modestly
in FY20. The average CPI Inflation has remained within the range of 6.5-7.5
percent in FY19 but is anticipated to be considerably higher in FY20.
[13]
There are considerable uncertainties around the projected
path of the financial vulnerability index (Chart 1b).
[14]
External account imbalances may have strong repercussions for the
financial markets. The uncertainty surrounding the equity market may continue
to strain the performance of mutual funds and insurance sector, which are
more dependent upon the capital market. The monetary tightening may affect
the debt repayment capacity of the borrowers with some lag. In the backdrop
of this challenging economic outlook, the corporate sector could perform below
its full potential. Therefore, improvement in macroeconomic conditions and
successful implementation of the IMF program will be the key drivers in ensuring
stability of the financial sector.
The assessment of resilience of the banking sector
to probable future domestic or global stress event in the medium term is of
paramount importance. This years stress testing results indicate that the
banking sector can withstand for three years the severe and protracted downturn
induced by hypothetical adverse global macroeconomic conditions. The large
banks, however, carry sufficiently higher capital buffers and are able to
sustain the impact of hypothesized shocks for around four years (See Chapter
3.3).
The 3rd wave of SBP Systemic Risk Survey (conducted
in Jan-2019), reveals that foreign exchange rate risk, balance of payment
pressures, widening fiscal deficit and increase in domestic inflation would
remain the key risks to financial system stability for the next six months
(See Box 1).
SBP is aware of these emerging challenges to the financial
sector and has taken steps to foster risk management practices and enhance transparency
in its regulated sectors, which constitute 76.21 percent of the total financial
sectors assets. SBP is also working in collaboration with other stakeholders
for formulating and implementing a comprehensive and well-stru ctured Macroprudential
Policy Framework to ensure stability of the financial sector (See Box 2).
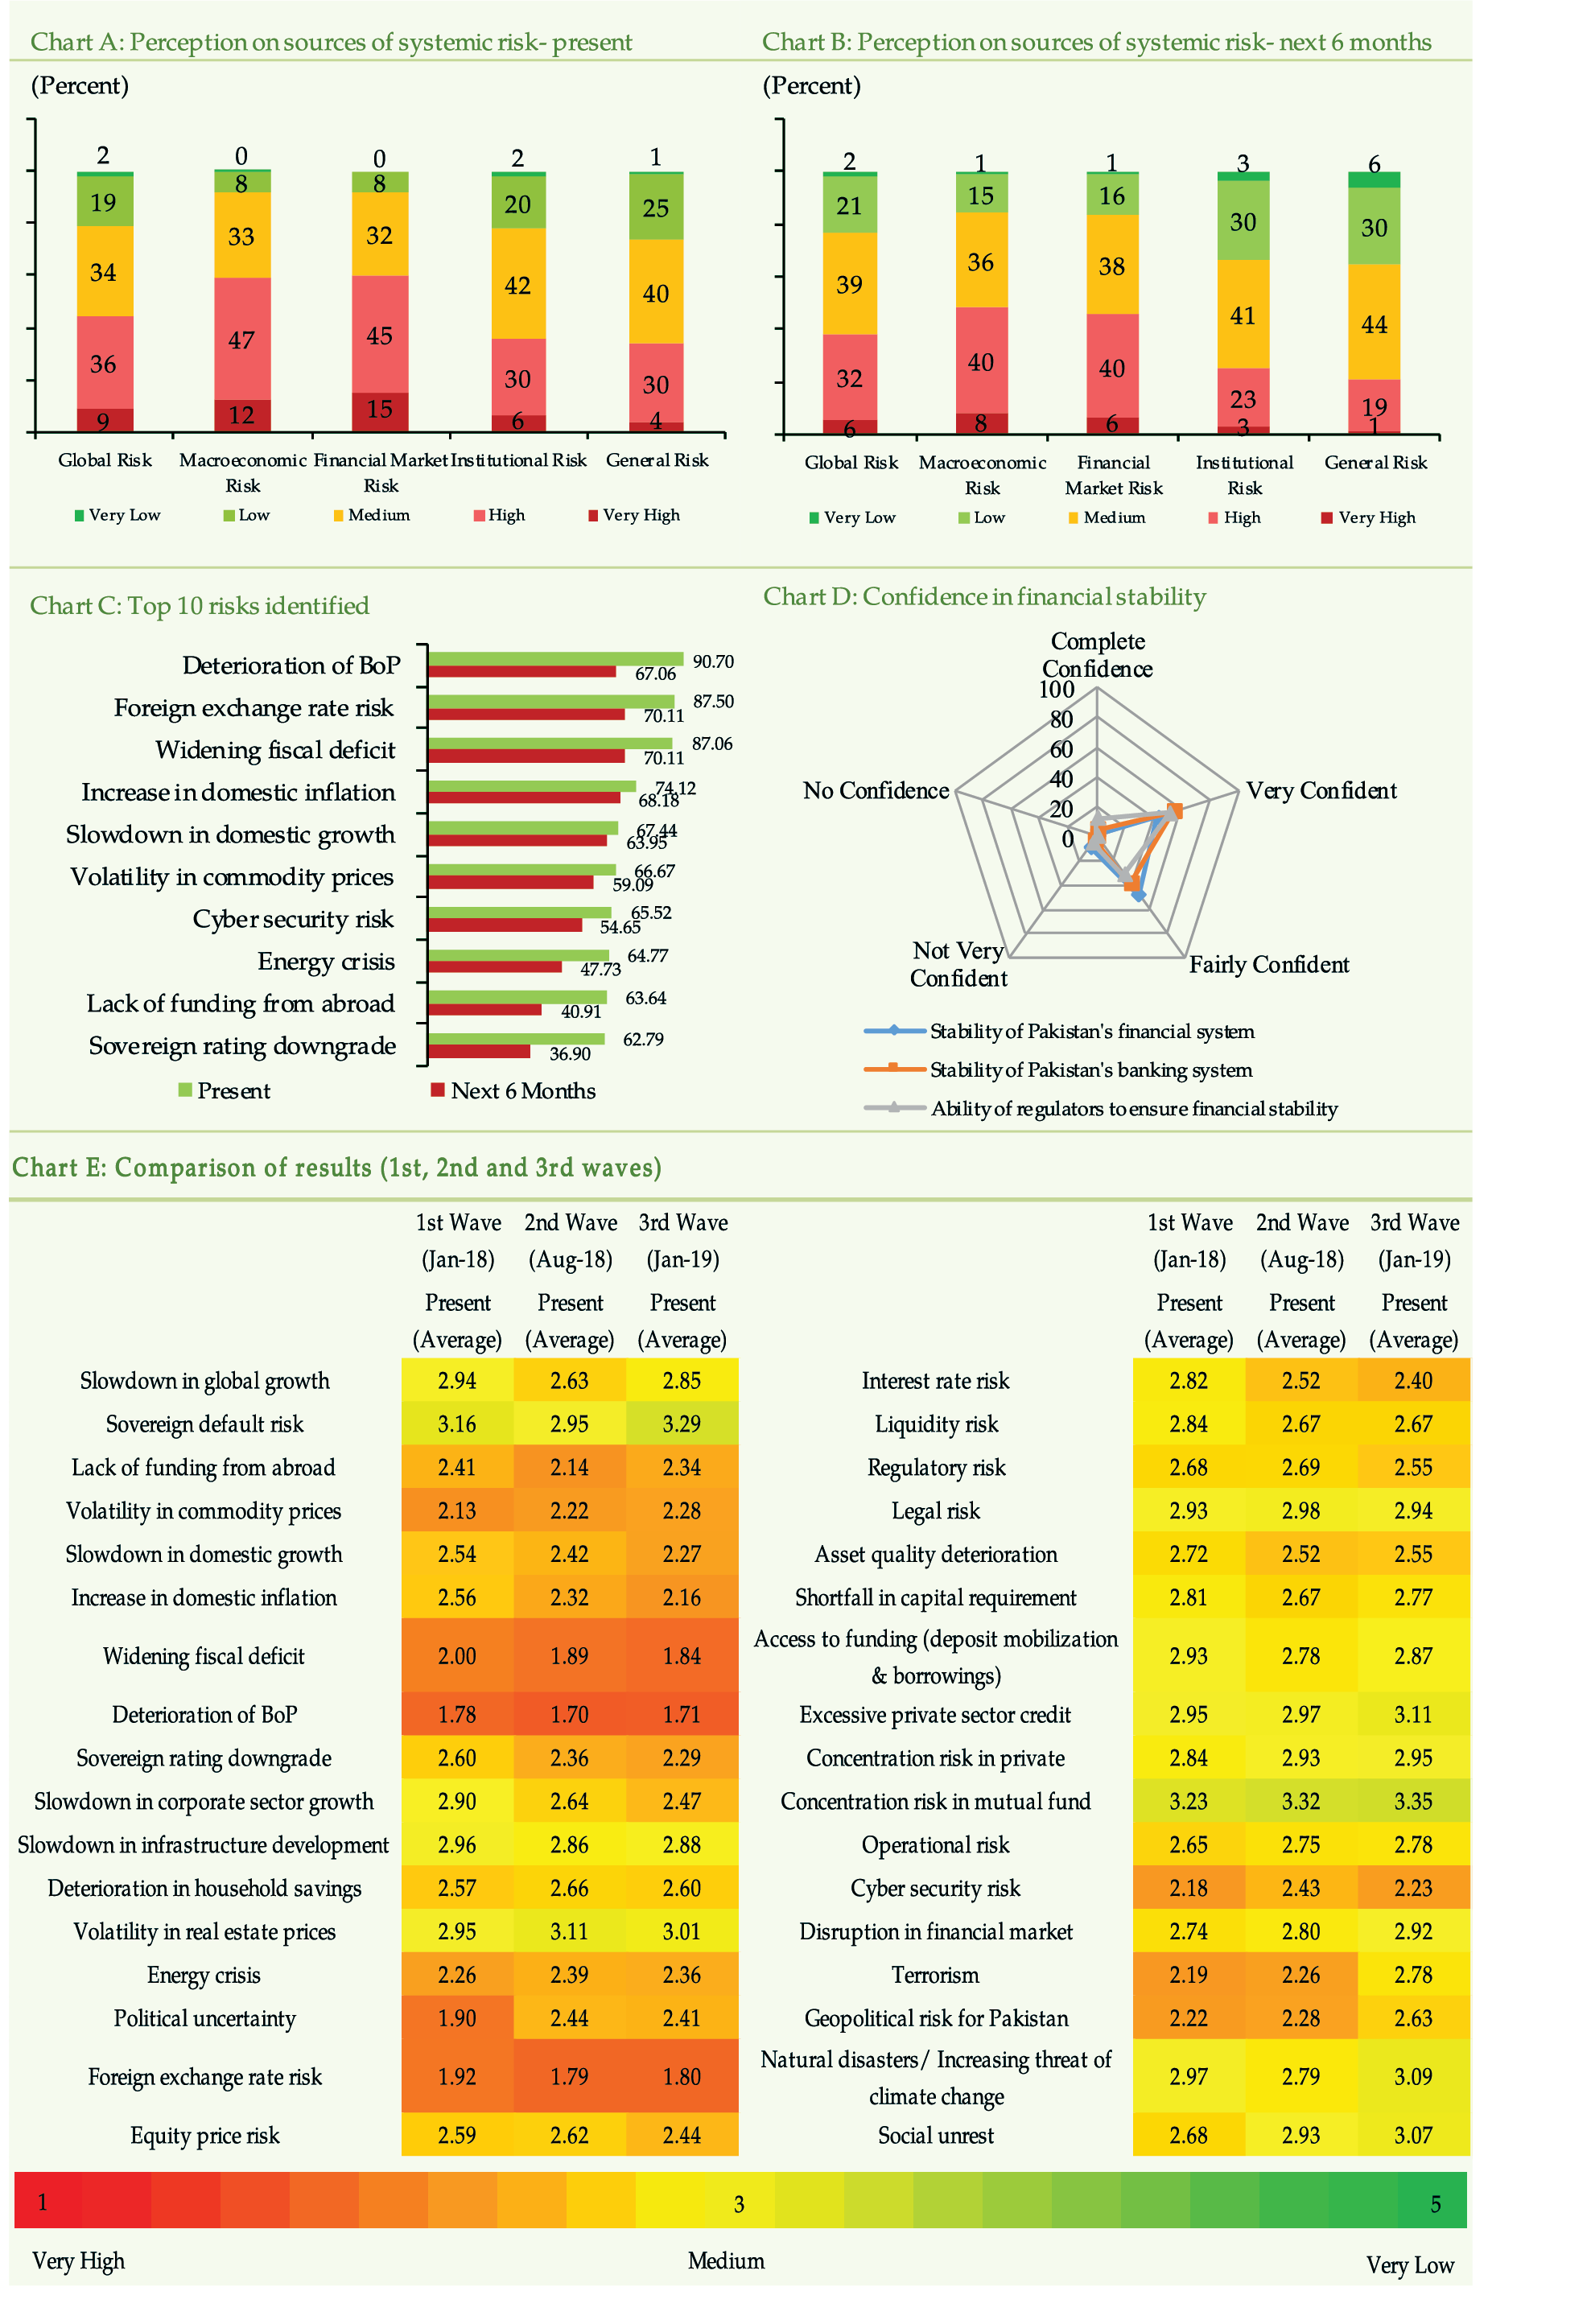
Box 1: SBP’s Systemic Risk Survey-3rd Wave (January, 2019)
SBP launched the 3nd wave of its biannual Systemic Risk Survey in January, 2019 to capture the risk perceptions of market participants and evaluate their confidence in the stability of the financial system. The respondents of the survey included senior executives of financial institutions, financial journalists and academia. [15]
The survey intends to gauge
the present and future (over the next six months) risk perceptions of the respondents
related to five broad categories i.e. global, macroeconomic, financial markets,
institutional and general risks. The overall response rate to the survey stands
at 40 percent.
[16]
Summary of Results
[17]
:
1. At aggregate level, financial market and macroeconomic
risks are perceived to be critical for financial stability both in current
scenario as well as over the next six months (Chart A & B).
2. Among all the risks, the highest cited risks at
present are deterioration in balance of payment, foreign exchange rate risk
and the widening fiscal deficit. In addition, increase in domestic inflation,
slowdown in domestic growth, volatility in commodity prices and cyber security
risks are other high risk
[18]
sources having the potential to undermine financial
stability (Chart C).
3. Over the next six months foreign exchange rate
risk, balance of payment pressures, widening fiscal deficit and increase in
domestic inflation were reported as key risks (Chart C).
4. The likelihood of occurrence of a high risk event
in Pakistans financial system over the short term is slightly higher than
medium term according to survey results.
5. A higher proportion of respondents show confidence
in the ability of regulators to ensure financial stability and felt confident
about the stability of the overall financial system (Chart D).
6. A comparison of the results of the past three
waves of the survey depict that risk perceptions of the respondents relating
to external sector, rising domestic inflation and slowdown in growth have
firmed up. On the other hand, risk of political uncertainty has subsided after
the conduct of general elections (Chart E).
Box 2: SBPs Initiatives
to Strengthen the Stability of the Financial Sector
Post Global Financial Crises (GFC) of 2008, ensuring
the stability of the financial system as a whole or, in other words, the containment
of systemic risk, has emerged as one of the key priority areas of the policy
makers.
[19]
Accordingly, various jurisdictions have established a well-defined
and formal Macro Prudential Policy Framework (MPPF). Though diversity prevails
across jurisdictions in terms of MPPF structure, the IMF-FSB-BIS, in a joint
policy paper in August 2016, have taken stock of such structures existing around
the globe. According to them, the key elements for an effective MPPF include
(a) defining the objective and scope of MPP, (b) establishing an elaborate institutional
structure, (c) assessing the systemic risk and identifying the policy toolkit,
and (d) collaborating to contain the cross-border spillovers.
[20]
Financial StabilityA Macro Perspective
The economies where banks are the key providers of
financial services, the MPPF largely revolves around the banking sector (IMF-FSB-BIS,
2016). Since in Pakistan the financial sector is bank centric with 73 percent
share in total assets, the primary responsibility for MPP lies with SBP.
[21]
This is the reason that SBP has been instrumental in making progress
towards formation of a well-structured MPPF.
SBPs strategic plan Vision 2020 envisages Strengthening
of Financial Stability Regime as one of the key goals. Under this goal, SBP
vowed to establish a comprehensive systemic stability framework consistent with
FSB principles.
To formalize an institutional structure for an MPPF,
SBP has made several arrangements that include formation of Financial Stability
Executive Committee (FSEC) within SBP, Council of Regulators (COR) comprising
SBP and SECP, and working towards establishing an overarching National Financial
Stability Council (NFSC) involving SBP, SECP, and Ministry of Finance.
[22]
Using these forums, SBP has initiated deliberations
to assess the macro-financial risks, their probable repercussions for the stability
of the financial sector and any needed remedial measures. The main themes of
discussions included macroeconomic developments that may impact the financial
sector, risks arising from Financial Action Task Force (FATF) evaluation of
Pakistan, designing a large exposure framework to contain concentration risk,
streamlining exchange of data/information between SBP and SECP etc.
In-house, SBP has strengthened the process of assessment and communication of systemic risk. To enhance its assessment of pro-cyclical systemic risk capabilities, SBP has brought in substantial improvements in its macro stress-testing regime to capture the macro-financial interlinkages. [23]
Further, a suit of variables has been identified, which serve as
Early Warning Indicators (EWIs) for build-up of systemic risk. These EWIs hint
at possible risks emanating from external and financial sectors and their interaction
with the real sector.
[24]
SBP has launched its Systemic Risk Survey (SRS) that
helps to gauge the risk perceptions and confidence of the respondents in the
stability of the financial system. The survey provides useful insights into
the current and emerging risks (over the next six months) to guide policy actions.
[25]
SBP has conducted regular waves of SRS to closely monitor the industrys
risk perceptions about the macroeconomy and the financial sector.
To contain structural risk, SBP has developed a framework
for designation and supervision of Domestic Systemically Important Banks (D-SIBs).
Under this framework, SBP has designated three large banks as D-SIBs with enhanced
supervisory and regulatory requirements. Additional supervisory measures for
D-SIBs include preparing comprehensive risk appetite framework, conducting macro
stress tests/scenario analysis, preparing recovery plans and enhanced supervisory
engagement with the top management and Board of the designated banks. Additional
regulatory measures include higher loss absorbency requirement in the form of
CET1 over and above the standard capital requirements.
To monitor up and down stream risks emerging from financial
conglomerates (including non-financial entities), SBP is conducting Consolidated
Supervision (CS) through continuous coordination with SECP. SBP has been in
touch with the IMF to further strengthen its CS framework.
Regarding communication of financial risk assessment,
SBP has been regularly publishing the yearly Financial Stability Review, half-yearly
Performance Review of the Banking Sector, and quarterly Compendium: Statistics
of the Banking System. All these publications enhance transparency by providing
detailed data including financial soundness indicators, discussion about various
emerging risks and mitigating actions taken there against.
In terms of introduction and calibration of MPP tools,
SBP has implemented Net Stable Funding Ratio (NSFR) and Liquidity Coverage Ratio
(LCR), as prescribed under Basel III capital standards, at 100 percent for both
NSFR and LCR. Further, in CY18, CAR has been increased from 11.275 percent to
11.90 percent, which is to be further raised to 12.5 percent by end of CY19.
This will help in building up of the liquidity and capital buffers in the wake
of recent credit expansion in the banking sector (See Chapter 3.1).
One of the key elements of MPPF is the international
coordination to limit the cross-border spillovers of policy actions. Though
the probability of cross-border spillovers is limited, SBP has active presence
on various international forums and coordinates with multilateral agencies,
national level stakeholders, and cross-border supervisory institutions.
An efficient ex-post resolution framework, including existence
of credible financial safety nets, limits the spread of a system-wide contagion
in a crisis. Such a framework helps maintain confidence in the system. In this
regard, with the objective of compensating the small and financially unsophisticated
depositors (to the extent of protected deposits), Deposit Protection Corporation
(DPC) has been established as a wholly owned subsidiary of SBP (under the Deposit
Protection Corporation Act-2016). The Corporation commenced its business with
effect from June 01, 2018
[26]
. Accordingly, DPC has taken following initiatives in order to initiate
and implement an effective deposit protection mechanism/ framework; (a) all
scheduled banks operating in Pakistan were notified as members of the Corporation,
thus included in the protection framework
[27]
, (b) DPC has rolled out deposit protection mechanism for banking
companies including Islamic banks effective from July 01, 2
018, in line with its statute and Core Principles for Effective Deposit
Insurance Systems issued by International Association of Deposit Insurers (IADI)
[28]
, (c) a separate deposit protection arrangement has been made for
the Shariah based deposits under Shariah Compliant Deposit Protection Mechanism
for depositors of Islamic Banking Institutions (IBIs)
[29]
and (d) all member banks have started paying the required premium
contributions on quarterly basis. [30]
Financial StabilityA Micro Perspective
The presence of sound financial institutions and efficient
markets is essential to ensure financial stability enabling the country to cope
with the emerging risks, adapt the changing market dynamics, and ensure smooth
flow of financial services. As per BIS-FSB-IMF (2016), micro prudential regulation
and supervision complements the macro prudential framework. SBPin its regulatory
and supervisory domainshas taken various measures to address the emerging risks.
The key focus areas include:
Foreign Exchange Policy & Operations: SBP is well
cognizant of the vulnerable external sector, which has jittered the foreign
exchange market (See chapter 2). It is monitoring the FX flows and taking
measures to limit speculative activities. It is also strengthening the operating
procedures to contain the likelihood of ML/FT activities. The following SBP
initiatives are worth mentioning:
To facilitate enhanced monitoring, SBP has introduced
amendments in Protection of Economic Reforms Act (PERA), 1992 through Finance
Act, 2018, which has allowed SBP to bind all carriers of foreign currencies
of Exchange Companies (ECs) to declare cash currencies to Custom authorities
(Chapter 4.4). Further, another amendment in PERA, has also restricted
deposit of cash foreign currency in foreign currency account to income tax returns
filers only and allowed the federal government to make rules governing deposits
in and withdrawals from the foreign currency accounts.
[31]
In order to keep abreast with the fast changing market
dynamics, SBP has made revisions in its Foreign Exchange Manual related to authorized
dealers, foreign currency loans, overdrafts and guarantees, forward exchange
facilities etc.
[32]
Weighing the risk associated with the virtual currency
(e.g. bitcoin, Litecoin, Pakcoin, OneCoin etc.) including volatility in the
price and use of such currencies in illegal activities such as money laundering
and the trade in illegal goods, SBP has barred ECs and ECs of B category from
processing, using, trading, holding, transferring value, promoting and investing
in Virtual Currencies/Tokens. Further, ECs and ECs of B Category have also
been restricted from facilitating their customers to transact in VCs/ICO tokens.
(See Chapter 6). AML/CFT: SBP has taken several initiatives to strengthen AML/CFT regime. These
include a) amendments in AML/CFT regulations to bring about clarity on various
terminologies, b) guidance on compliance of SROs and notifications issued by GoP
under UNSC resolutions, and c) enhancement in scope of KYC requirements.
Overseas Operations: The overseas operations
contribute around 5 percent share in the assets of the banking sector. In response
to challenges emerging for the banking sector in the overseas markets, SBP has
issued a comprehensive Governance Framework for banks overseas operations in
2018. The framework is aimed at strengthening banks capacity to understand,
identify and manage various risks posed by its foreign operations. Banks are
required to strengthen their governance, risk management & compliance practices
for their overseas branch & subsidiary operations.
[34]
Quality of Disclosures: SBP has revised the
financial statement format/disclosures of banks/DFIs to align them with the
regulatory changes and international best practices. The objective is to bring
consistency in financial reporting among the banking industry while enhancing
the transparency and quality of their disclosures.
[35]
[36]
Dynamic Provisioning: IFRS 9, the new accounting
standard has presented a major overhaul of financial instruments accounting
by introducing an expected credit loss approach based on probability of default.
SBP has advised the banking industry in 2018 to carry out a Quantitative Impact
Assessment of IFRS 9 implementation on their balance sheets. The purpose of
this exercise was to determine the banking sectors readiness and identification
of the challenges expected during its implementation. This step is expected
to complement the MPPF later as IFRS 9 encourages dynamic provisioning.
Risk Based Supervision: SBP has made major strides
in the development of Risk Based Supervision (RBS) framework by entering into
a Long Term Country Engagement (LTCE) program with Toronto Centre (TC) for capacity
building of SBP officials. LTCE program spreads over two and a half years (July
2018 Dec 2020). During this time, the RBS framework will be developed, tested
and refined.
IT Inspection: For comprehensive assessment
of IT systems of the supervised financial institutions, Information Systems
Inspection Framework (ISIF) has been developed. ISIF would form part of overall
RBS framework, which is presently in development phase. ISIF assess the risk
in core IT functions i.e. IT operations, IT value delivery, Alternate delivery
channels, Project management and IT procurement & Service Level Agreement
(SLA) management, while controls and governance aspects are also assessed.
Banking Conduct and Consumer Protection: SBP considers
Financial Consumer Protection or Responsible Banking Conduct crucial for stability
and inclusive growth of the sector. In this connection, some of the most eminent
conduct milestones achieved by SBP in CY18 include:
·
SBP has issued guidelines on Prohibited Banking Conduct. These guidelines will
enable banks to exhibit responsible conduct by ensuring the inclusion of adequate
and preemptive controls in their Fair Treatment of Consumers (FTC) frameworks.
[37]
·
In order to strengthen the FTC regime, SBP has embraced effective conduct monitoring
tools to collect market data, highlight malpractices, analyze the root causes
and recommend corrective actions. Accordingly, SBP has recently conducted off-site
thematic examination on Marketing Disclosures for Individual Lending Products
by banks.
·
In view of digital transformation, the functional importance and allied conduct
risks of call centers, SBP undertook a diagnostic review of Call Center Management
at banks. Based on the thematic review, detail guidelines on the Call Center
management, eliciting the related bare minimums, have been issued for the banks
and MFBs.
[38]
·
SBP has granted the certificate of commencement of business to Aequitas Information Service Limited, first private credit bureau in Pakistan, and license to another credit bureau viz. Data Check Limited in the year 2018.
Financial Market Infrastructure (See Chapter 5): Pakistan Real Time Interbank Settlement Mechanism (PRISM) is the payment system of systemic importance facilitating large scale transactions. Keeping in view that significant developments have taken placed in terms of scope and operational efficiency of PRISM, SBP has updated PRISM Operating Rules (PORs) which are in line with international standards and offer directions related to PRISM (RTGS) business operations. [39]
Electronic Fund Transfers
(EFTs) enable customers to access their bank accounts electronically for fund
transfers and account management using different channels like ATMs, internet
and mobile banking etc. SBP has issued Regulations for EFTs with the purpose
to promote, ensure consumer protection and payments transparency by standardizing
EFTs as broadly outlined in Payment System & Electronic Fund Transfer (PS&EFT)
Act 2007
[40]
. These regulations identify the minimum information of originator
and beneficiary required to initiate/process an EFT, highlight the responsibilities
of originator, Payment System Operators (PSOs) /Payment Service Providers (PSPs)
and beneficiary compensation policy for unauthorized and / or delayed EFTs,
disclosure requirements and dispute resolution process etc.
To safeguard banks/MFBs and
their customers from potential losses due to cyber-crimes and online banking
frauds, SBP has issued a comprehensive set of instructions advising banks
to take pre-emptive measures and ensure security of card data.
[41]
A vast literature has established
that, besides supporting poverty reduction and economic growth, the financial
inclusion also promotes financial stability.
[46]
In fact, providing greater access and better uses of financial services
to a vast under-privileged section of the society strengthens the financial
stability, given the country has already implemented financial infrastructure
and skilled supervision (Okpara 2011; Prasad 2010; Cull et al. 2012). Morgan
and Pontines (2014) highlighted that increased share of lending to small and
medium-sized enterprises (SMEs) aids financial stability, mainly by reducing
non-performing loans (NPLs) and the probability of default by financial institutions.
Han and Melecky (2013) observed that financial inclusion, measured by wider
access to and use of deposits, can build the banks deposit base stronger in
period of financial trauma, which ultimately promotes financial stability of
countries, especially the middle income countries. On the other hand, greater
financial access may lead to financial risks if driven by rapid credit growth
or the expansion of relatively unregulated parts of the financial system (BIS
Quarterly Review, March 2015).
SBP has long been promoting
the development finance including microfinance, SME finance, Agriculture finance,
Infrastructure and Housing finance and Islamic Banking. Increasing financial
inclusion is one of the key strategic goals of SBP Vision 2020. The developments
in this regard are as under:
National Financial Inclusion
Strategy (NFIS): To promote financial inclusion, government launched NFIS in
2015. With the ultimate objective of enhancing inclusion, the federal government
has published new policy directions for its implementation during the next five
years.
[47]
,
[48]
The policy offers a national framework, definite action plan and
targets for achieving universal financial inclusion. The updated policy contributes
headline targets and specific tasks for their accomplishment, assigned to the
relevant institutions, with given timeline and Key Performance Indicators (KPIs)
for implementation until 2023.
[49]
These targets focus on broad areas, such as;
-
Enhancing usage of digital payments (65 million transaction accounts including 20 million share of women)
-
Increasing deposit base to 55.0 percent of GDP [50]
-
Promoting SME finance (achieve 17 percent of private sector credit and increase borrowers to 700,000) [51]
-
Increasing agricultural finance (target annual disbursement of PKR 1.8 trillion and cater to 6 million farmers digitally), enhancing low-cost housing, increasing share of Islamic banking (to 25 percent of banking industry and attain 30 percent share in overall branch network)
Microfinance: In order to address
funding constraints of the microfinance sector, SBP has established a Line of
Credit (LoC) Fund for Microfinance Banks (MFBs) and Non-Bank Microfinance Companies
(NBMFCs) for onward lending to microfinance borrowers. This has been carried
out with the funding support of GoP under WBs Financial Inclusion and Infrastructure
project.
[52]
SME Financing:
To promote SMEs, SBPs following initiatives are noteworthy:
-
The scope of current Credit Guarantee Scheme (CGS) has been extended through inclusion of low-end medium enterprises under this scheme.
-
To enable un-incorporated SMEs to use moveable assets as collateral, SBP is facilitating establishment of an electronic registry under Financial Institutions (Secured Transaction) Act, 2016.
-
In consideration of the fact that majority of the SMEs lack expertise to professionally manage financial, technological, marketing and human resource aspects of their businesses, banks have been advised to adopt Non-Financial Advisory Services (NFAS) in their SME banking to better serve their existing and potential SME clients. [54]
-
SBP introduced the modus operandi for the Refinance Scheme for Working Capital Financing of Small and Low-End Medium Enterprises in selected economic sectors. [55] Similarly, in an effort to improve financing access for women entrepreneurs, the coverage under Refinance and Credit Guarantee Scheme for Women Entrepreneurs in Underserved Areas has been extended by increasing the number of eligible districts. [56]
Housing Finance: The housing finance
has a meager share in Pakistan (0.5 percent of GDP). In order to promote housing
finance, Pakistan Mortgage Refinance Company (PMRC), established with the equity
contributions from Financial Institutions (FIs) and the Government of Pakistan
(GoP), has been granted permission to commence business. PMRC is mandated to
provide long term funding to Primary Mortgage Lenders (PMLs) and will also contribute
to the development of bond market.
Islamic Finance: In order to provide
Shariah compliant alternative of conventional Long Term Financing Facility (LTFF),
SBP has issued Mudarabah based Islamic Long Term Financing Facility (ILTFF)
to facilitate export industries for purchase of imported or locally manufactured
new plant and machinery.
[57]
SBP has revised Shariah Governance Framework for Islamic Banking Institutions. The framework covers the roles of various organs of Islamic. Also, IBIs have been advised to undertake enhanced measures for training and capacity building of their staff.
[1]
IMF, World Economic Outlook Update, July 2019. As per IMF estimates,
the global economy is expected to grow by 3.2 percent during 2019.
[2] Pakistan Bureau of Statistics (PBS).
http://www.pbs.gov.pk/sites/default/files//
[3] Source: PBS
http://www.pbs.gov.pk/sites/default/files//
industry_mining_and_energy/qim/
2019/web%20note%20June%2019.pdf
4] 12 months moving average inflation (Source: SBP Inflation Snapshot,
http://www.sbp.org.pk/ecodata/MPM.pdf)
5]
Overseas Investors Chamber of Commerce and Industry (OICCI) Survey,
Seventeenth Wave, January 2019
https://www.oicci.org/wp-content/uploads/2019/02/OICCI-BCI-
Survey-Wave-17-Highlights-December-20181.pdf
SBPs Business Confidence Surveys, 2018-19.
http://www.sbp.org.pk/research/BCS-r.asp
[6]
Government exposure includes investments in government securities
and lending to public sector entities.
[7]
Fresh NPLs, generally, require lower provisions leading to rise in
net NPLs. As a result, the net NPLs to net Advances ratio and Capital impairment
(net NPLs to Capital) ratio increase.
[8]
The government has abolished the withholding tax on deposit withdrawals
for filers while it maintained 0.6 percent tax rate for the non-filers in the
interim budget 2019. (Finance Supplementary (Second Amendment) Act, 2019)
9]
This comprises minimum CAR requirement of 10 percent and capital
conservation buffer of 1.9 percent that will increase to 2.5 percent by the
end of CY19 (BPRD Circular No. 6 of 2013).
10]
The framework follows two steps approach; in first step, a sample
of banks based on quantitative and qualitative criteria is identified. In the
second step, among these sample banks, D-SIBs are designated based on Size,
Interconnectedness, Substitutability and Complexity.
11]
http://www.sbp.org.pk/press/2018/Pr-14-Jun-18.pdf
12]
CDC and NCCPL are corporate securities settlement systems which have
been allowed as special participants of PRISM for settlement of transactions
in the form of multilateral net settlement batches.
13] State Bank of Pakistan. (2019). Monetary Policy Statement. May 2019
http://www.sbp.org.pk/m_policy/2019/MPS-May-2019-Eng.pdf
[14]
Most of the underlying indicators of FSVI have been projected
using the exponential smoothing technique of Holt-Winters.
[5]
The respondents included executives from commercial banks, insurance
companies, exchange companies, MFBs, DFIs, major financial market infrastructures,
financial journalists, members of academia, SECP officials and think tanks.
6]
The 3rd wave of the survey was sent to 230 respondents
out of which 92 responded.
[17]
The results presented
here are based on responses to the survey and do not necessarily reflect the
State Bank of Pakistan views on risks to the financial system
[18]
High risk is identified by aggregating percentage of respondents
by clubbing together percentage of respondents choosing either high or very
high as response to a particular risk category or type in the survey questionnaire.
[19]
Systemic risk has two dimensions i.e. Pro-cyclical (or Time dimension)
and Structural (or Cross-sectional dimension).
[20]
Please see Elements of Effective Macro Prudential Policies, BIS,
August 2016.
[21]
Pakistan has shallow capital market (low market capitalization to
GDP ratio), non-complex thin volume trading in financial markets, limited cross
border exposures, almost negligible volume of mortgage financing (thus, expectedly,
limited role of real estate prices), and less reliance on wholesale funding
(thus, expectedly, low interconnectedness)
[22]
For further detail, please see FSR 2017 Overview Box 2
[23]
The macro stress testing model include univariate Auto Regressive
Moving Average (ARMA), Vector Auto Regressive (VAR) model, vector error correction
model (VECM) etc.
[24]
These EWIs incorporate spreads, market price indicators
and their volatility, deviation from trend, and growth rates of financial and
external variables.
[25]
SRS is a biannual survey and its respondents include executives from
commercial banks, insurance companies, exchange companies, MFBs, DFIs, , major
financial market infrastructures, financial journalists, members of academia
and SECP officials and think tanks.
[26]
DPC Circular No. 02 dated May 31, 2018
[27]
DPC Circular No. 03 dated June 22, 2018
[28]
DPC Circular No. 04 dated June 22, 2018
[29]
This mechanism has been developed in accordance with the requirements
of Section 7(3) of the Act, to comply with the Shariah requirements of such
protection arrangement
[30]
The protected amount has been determined by the Corporation to be
PKR 250,000 per depositor per bank, which is 1.46 times of GDP per capita.
[31]
EPD Circular Letter No. 05 of 2018
[32]
FE Circular No. 14 of 2018
[33]
FE Circular No. 03 of 2018
[34]
BPRD Circular No. 06 of 2018
[35]
BPRD Circular No. 02 0f 2018
[36]
Few changes include as (a) movement of revaluation surplus/deficit
under equity head, (b) separate line for intangible assets, (c) single line
presentation for provision against NPLs and investment, (d) addition of new
line for income from derivative, (e) addition of state of comprehensive income,
and (f) few changes in the notes of financial statements.
[37]
BC&CPD Circular No. 02 of 2018
[38]
BC&CPD Circular No. 01 of 2018
[39]
PSD Circular No. 02 of 2018
[40]
PSD Circular No. 03 of 2018
[41]
PSD Circular No. 09 of 2018
[42]
PSD Circular No. 05 of 2018
[43]
PSD Circular letter No. 02 of 2018
[44]
PSD Circular No. 04 of 2018
[45]
PSD Circular No. 01 of 2018
[46]
Indicators used to proxy financial inclusion (e.g. share of
credit provided to SMEs, number of bank branches per 1000 population, number
of ATMs per 1000 population, number of SME borrowers, number of accounts at
formal institutions, and financial inclusion index etc.)
Indicators used to proxy financial stability
(bank Altmans Z-score, stock market volatility, provision for non-performing
loan, standard deviation of deposit, financial stability index etc.)
[47]
Publication NFIS Governments 100 day Agenda (retrieved from http://www.finance.gov.pk/NFIS.pdf)
[48]
In 2015, Government of Pakistan (Ministry of Finance (MoF)) and SBP
introduced the National Financial Inclusion Strategy (NFIS) per implementation
plan until 2020.
[49]
With regard to the implementation framework, a central monitoring
and coordination system has been realized through the creation of Transformation
Office at PM office. The ultimate responsibility for the implementation rests
with the assigned institution.
[50] According to World Bank, the deposit to GDP ratio was 32.0 percent in 2016
(https://fred.stlouisfed.org/series/
[51] As of December 30 2018, the credit to SME sector as percent of Pvt. Sector financing was 8.46 percent and SME borrowers were 180,704. (Source: Annual SME Finance Review, 2018:
http://www.sbp.org.pk/sme/PDF/DFG/2018/
[52]
AC&MFD Circular No. 01 0f 2018
[53]
IH&SMEFD Circular Letter No. 01 of 2018
[54]
IH&SMEFD Circular No. 10 of 2017
[55]
This scheme was introduced in December 2017 (IH&SMEFD Circular
No. 11 of 2017)
[56]
IH&SMEFD Circular Letter No. 02 of 2018
[57]
IH&SMEFD Circular No. 01 of 2018
1 Global and Domestic
Macro-financial Environment
The global economic cycle has trended downwards
during 2018 amid rising trade tensions and tightening financial conditions.
Short-term risks to global financial stability have risen modestly, while
the medium-term risks remain elevated. Financial vulnerabilities in the
global financial system continue to build-up in the form of elevated leverage
and stretched asset prices. Likewise, the domestic economy has decelerated
owing to rising twin deficits, elevated inflationary pressures and the
stabilization measures taken to contain the macroeconomic imbalances.
A combination of monetary tightening and fading economic activity may
undermine the repayment capacity of the borrowers. The pace of economic
expansion is expected to remain weak in the short-term.
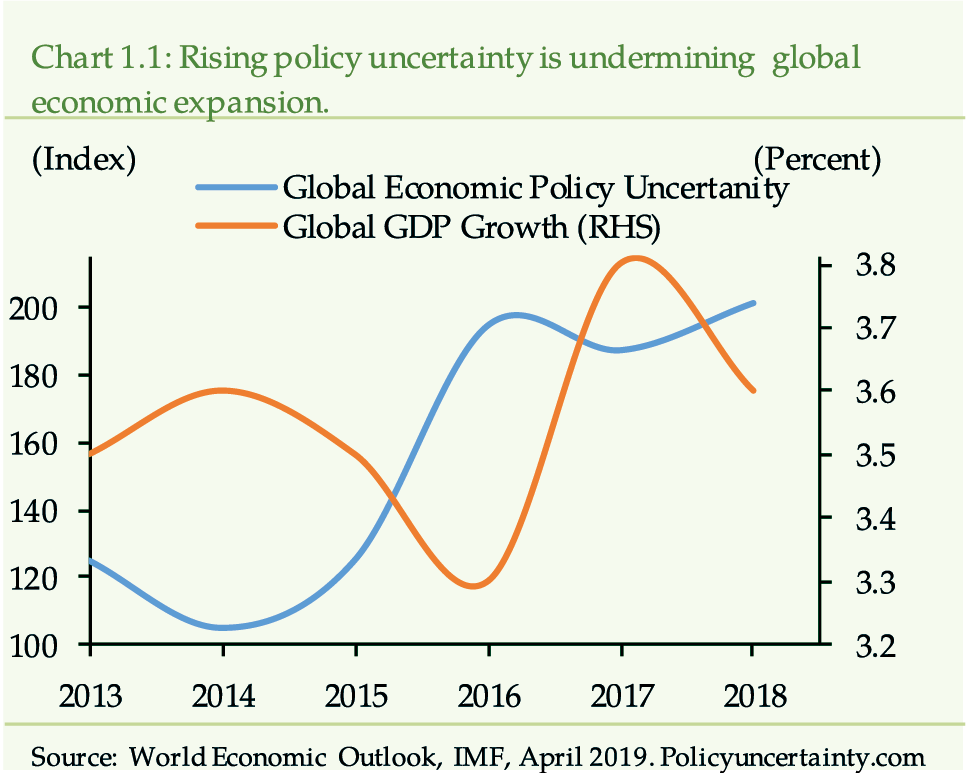
Pace
of global economic expansion has moderated during 2018
In 2018, the global growth momentum has softened
to 3.60 percent after peaking at 3.80 percent in 2017. Increased policy
uncertaintydriven by trade tensionsand tighter financial conditions,
particularly in the emerging markets and developing economies (EMDEs),
have primarily undermined the pace of global expansion (Chart 1.1).
[1]
Among the advanced economies (AEs), weak economic
activity in the euro area, United Kingdom and Japan along with rising
vulnerabilities in certain EMDEs (i.e. Turkey and Argentina) have resisted
the world economy to maintain its growth momentum. Contrary to the global
economic slowdown, the growth in the US has accelerated (2.90 percent
in 2018 versus 2.20 percent in 2017), which has helped moderate the global
downturn. (Table 1.1).
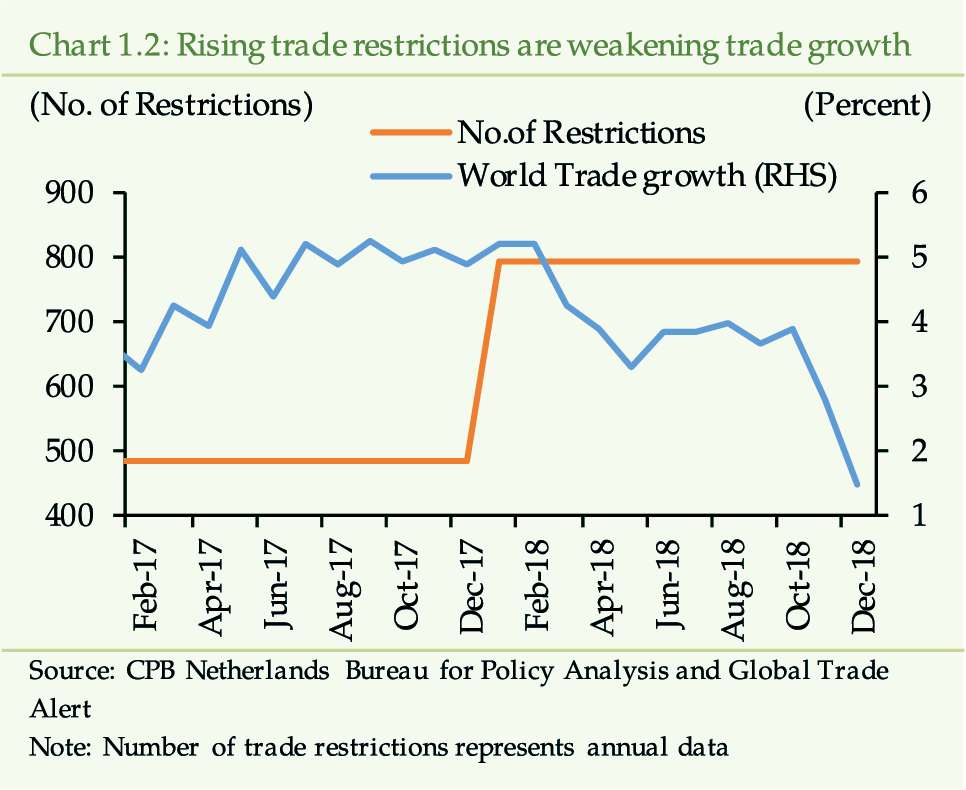
The mounting trade tensions have weakened the
business confidence and resultantly global trade has observed weaker growth
of 3.27 percent in 2018 against 4.68 percent in 2017 (Chart 1.2).
[2]
The trade restrictions, in turn, are hindering the overall
growth and investment.
[3]
The downward trend in global economy is, thus, likely
to continue if the trade tensions among major economies, particularly,
the US and China are not resolved.
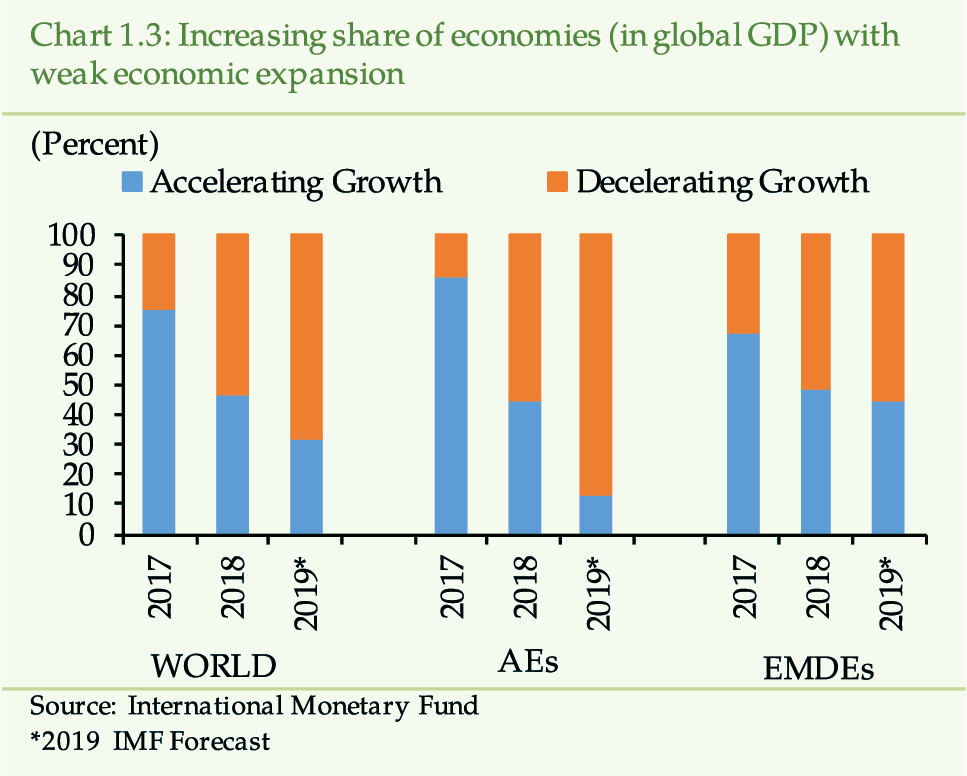
along
with receding growth synchronization
Besides moderating, the global economic growth
has remained less synchronized during 2018. In 2017, 58 percent of the
worlds economies (representing 75 percent of global GDP) had experienced
upturn in growth. However, in the reviewed year, the expansion has been
contained to 52 percent of the economies (representing 47 of global GDP),
indicating a possible tilt of the business cycle towards a trough (Chart
1.3).
[4]
A
number of factors have constrained euro area growth
Euro area has struggled to grow as it recorded
1.80 percent growth in 2018down from 2.40 percent in the year 2017. The
notable slowdown in the economic activity has come from: (i) waning consumer
and business confidence, (ii) weak industrial output in Germany and France
due to revision of auto emission standards and the street protests (yellow
vests movement), respectively, (iii) fiscal policy uncertainty; and (iv)
dent in the external demand for exports owing to appreciation of Euro.
[5]
Moreover, the growth outlook may further deteriorate to 1.30
percent in 2019, if the uncertainties arising from trade tensions and
a no deal-Brexit continue.
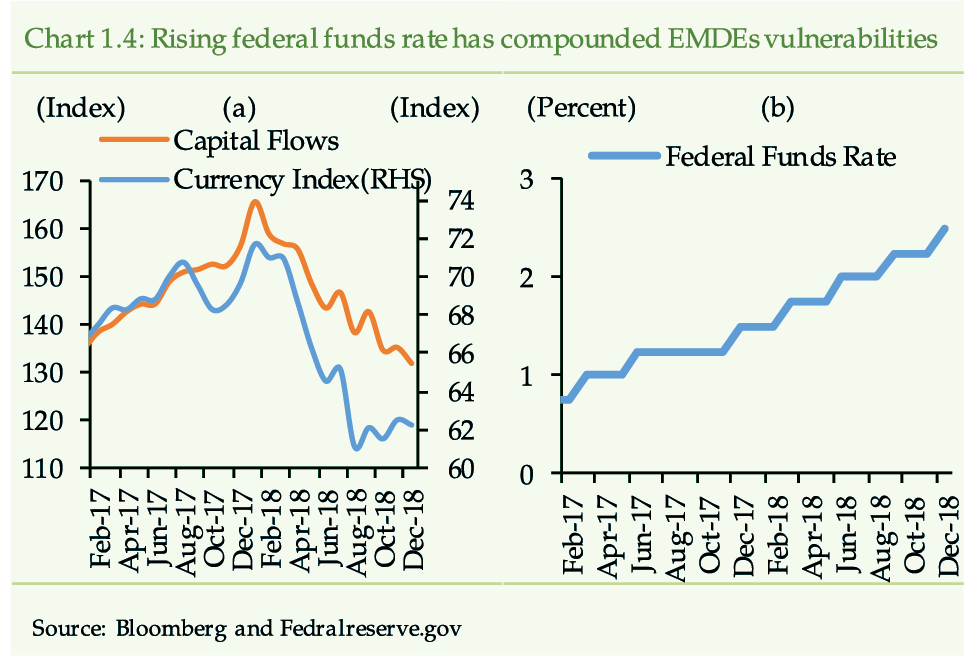
EMDEs
including China have followed slow growth trajectory
The EMDEs have delivered 4.50 percent growth
in the year 2018down from 4.80 percent achieved in the previous year.
Corrective policy measures in response to growing idiosyncratic vulnerabilities
(i.e. macroeconomic imbalances, external leverage etc.), coupled with
capital outflows in the backdrop of rise in federal funds rate and escalating
trade tensions, have constrained their economic activity and triggered
risk aversion (Chart 1.4).
[6]
,
[7]
However, jittery sentiments in such markets have not spread
to other EMDEs because the country-specific factors seem to be instrumental
in investors decisions.
[8]
Among the EMDEs, Chinese economy has slightly
moderated to 6.60 percent in 2018 as compared to 6.80 percent in the previous
year. This deceleration has largely resulted from regulatory measures
taken during 2017 to limit high indebtedness
[9]
, partly brought about by growing shadow banking
intermediation, and softening of export demand due to on-going trade conflict
with the US.
Anticipating further deceleration in economic
activity, the Peoples Bank of China has provided liquidity support and
reduced reserve requirements in early 2019. Moreover, there has been targeted
fiscal policy loosening as well.
[10]
The uncertainties surrounding trade tensions
with the US are likely to critically determine future economic course
of the Chinese economy. Unless the aforementioned dynamics play out positively,
[11]
the growth is expected to further moderate to 6.18
percent in CY19.
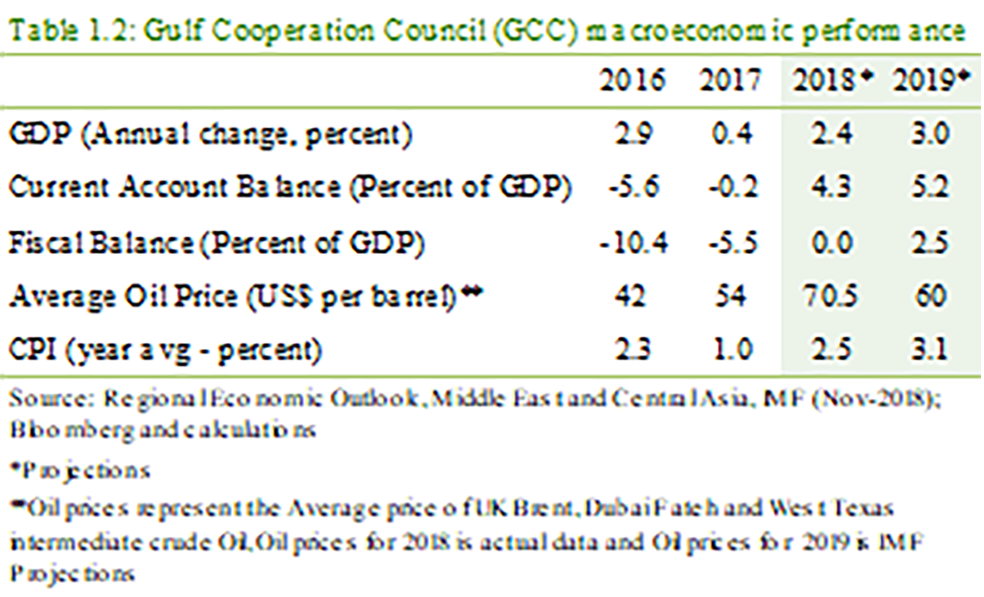
While
GCC economies have performed well
The pattern of economic activity in the Gulf
Cooperation Council (GCC) economies is tied to the oil price dynamics.
In 2017, as the oil prices dropped so did their growth (0.40 percent).
With increase in oil prices, GCC economies are expected to bounce back
with 2.40 percent growth in 2018 (Table 1.2). The economic recovery
has allowed some fiscal space to UAE, Qatar and Kuwait to invest in public
projects.
The growth outlook though encouraging, remains
uncertain as it is mainly contingent upon the future path of oil prices.
Rising trade concerns, geo-political tensions in the gulf region, as well
as global growth slowdown could dampen the demand for oil. This may jeopardize
GCC economies growth prospects.
and
so has the US economy
The US economygiven its considerable weight
in the global outputhas uniquely performed by growing at 2.90 percent
in 2018, higher than 2.20 percent observed in the previous year. The continued
growth momentumdespite Feds monetary tightening during 2018is due to
strong labor market conditions and robust consumption spending.
In the near term, nonetheless, the restrictions
on bilateral trade may dent exports and investments. Therefore, the economic
activity is expected to slow down to 2.30 percent in 2019.
[12]
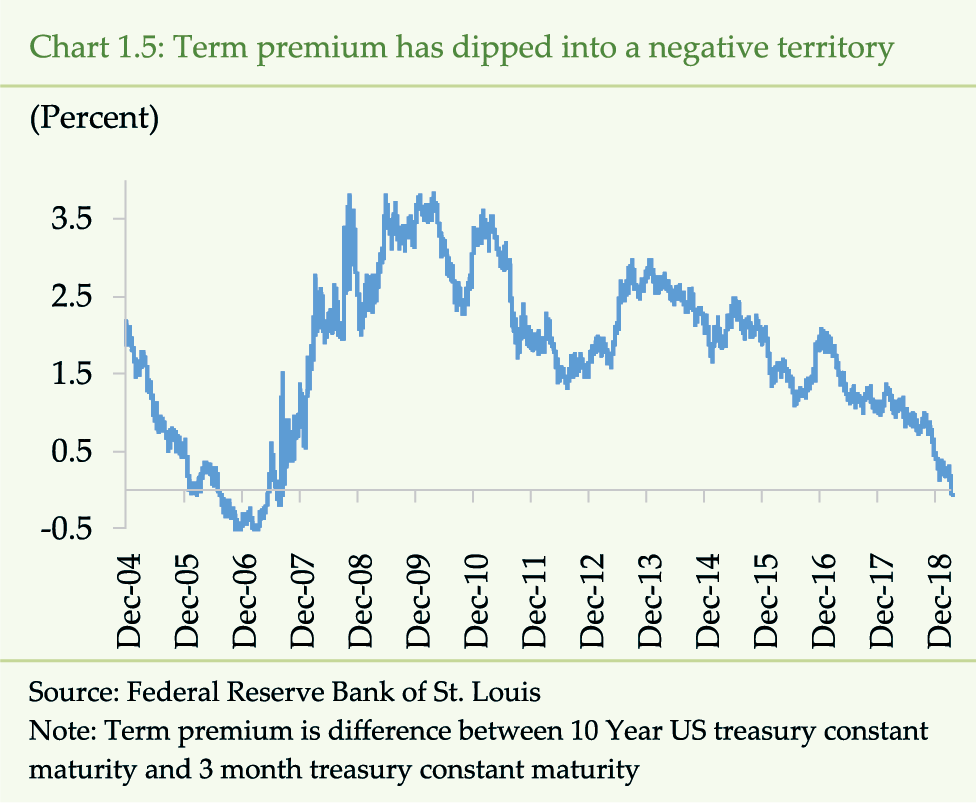
The growth momentum may further stall as the fiscal
expansion fades down. More recently, the term-premium
[13]
in the US has dipped into negative territory indicating
increased risk perceptions of the investors about US growth outlook (Chart
1.5).
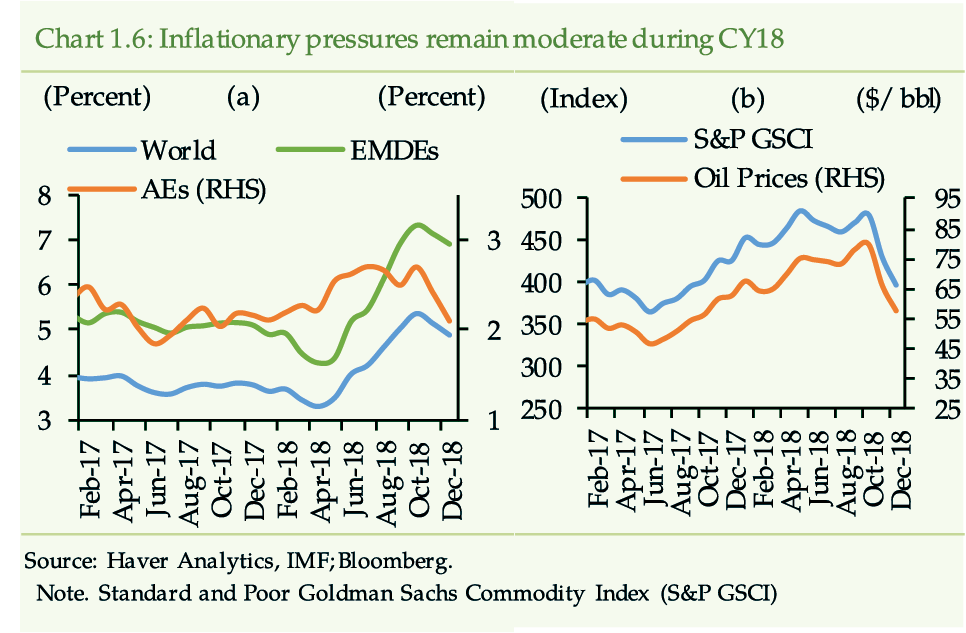
Inflationary
concerns, due to softening global growth, remains benign
Globally, inflationary pressures have remained
moderate during CY18 (Chart 1.6a). In AEs, inflation has hovered
around 2.0 percent level during 2018up from 1.70 percent in CY17.
[14]
In EMDEs, it has inched-up to 4.80 percent compared
to 4.30 percent in 2017. Marginal uptick in the headline inflation is
due to rising oil prices
[15]
(Chart 1.6b) and the pass through impact of currency
depreciation in EMDEs. It is important to note that the core inflation
across AEs and EMDEs has remained subdued reflecting softening of economic
momentum.
Risks
to global financial stability have somewhat risen
Near-term risks to global financial stability
have risen modestly during CY18 amid tightening in financial conditions.
Short-term risks to global financial stability could sharply elevate in
response to sudden tightening of financial conditions, unexpected growth
slowdown, further increase in trade tensions, and geopolitical risks.
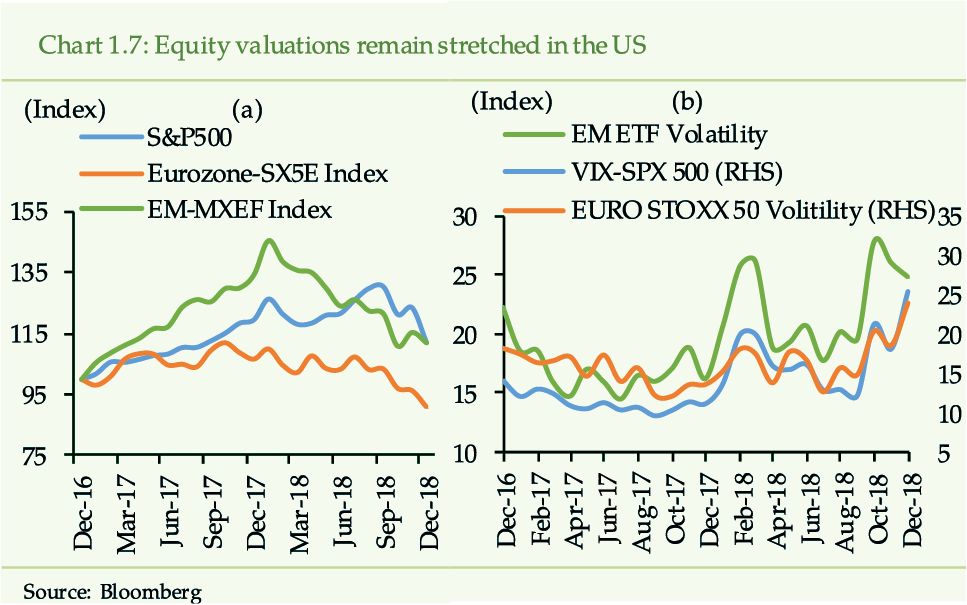
and
the financial vulnerabilities continue to build-up
A prolonged period of easy financial conditions
has been feeding vulnerabilities into the global financial system; hence,
the medium-term risks to global financial stability remain elevated. The
stretched equity valuations in the US along with lower volatility
[16]
, amid accommodative monetary policy, represent
vulnerabilities in the form of possible asset price corrections.
[17]
(Chart 1.7a-b)
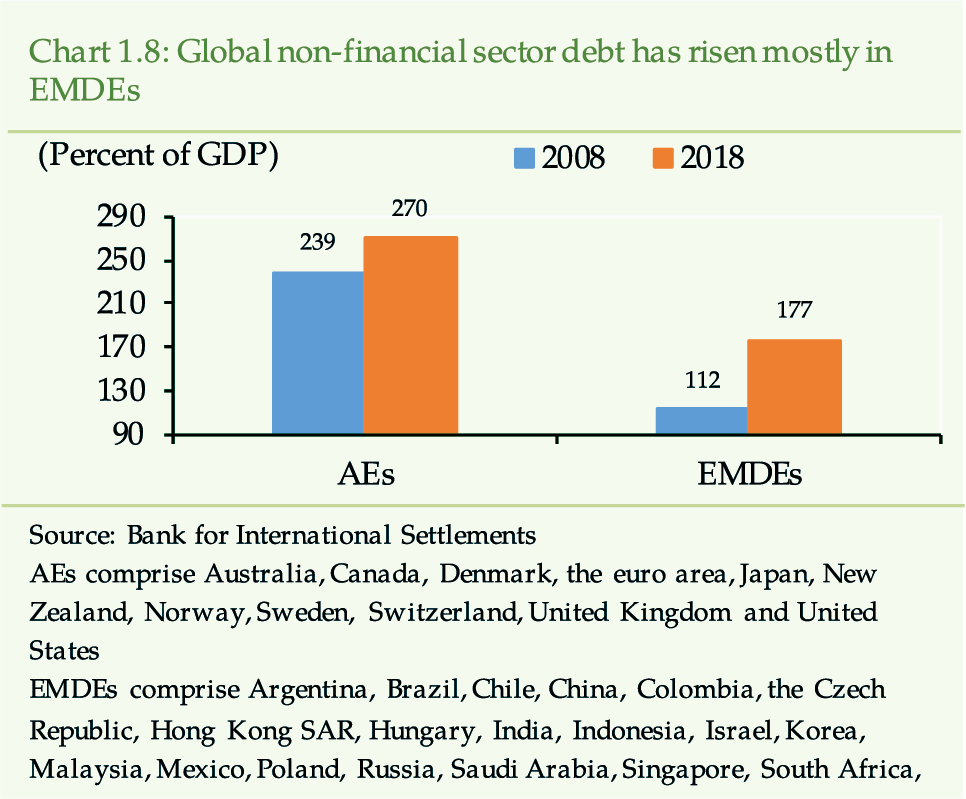
Besides, low interest rates in AEs are triggering
leverage. Total non-financial sector debt stands at USD 183 trillion (217.80
percent of world GDP)up from USD 119 trillion (178.90 percent of world
GDP) a decade earlier.
[18]
Most of the global debt pertains to AEs (69.41 percent share
in the global debt). However, EMDEs have increased accumulation of the
global non-financial debt as a percentage of GDP during the last decade
(Chart 1.8).
It deserves emphasis that in AEs, financial risk
taking has increased and resultantly the stock of lower-rated investment
grade bonds (BBB) has quadrupled since the global financial crisis.
[19]
A reversal in financial conditions or negative growth shock
could hamper repayment capacity of the weaker firms and may trigger defaults.
EMDEs
near-term outlook is less than encouraging
The growth in EMDEs is likely to dip to 4.4 percent
in the year 2019slightly down from 4.5 percent in 2018. Slowing pace
of economic activity reflects the impact of deceleration in Chinas growth,
recession in Turkey, the lagged impact of weaker activity in 2018, and
downturn in Iran.
Moreover, the interplay between the idiosyncratic
challenges and the external environment marked by softening growth momentum
in AEs and elevated trade concerns would continue to determine the near-term
prospects for the EMDEs.
[20]
Domestic Developments
After
robust economic expansion during FY18, economic prospects are fading
The domestic economy has managed to grow by 5.53
percent during FY18up from the 5.22 percent in FY17. The momentum was
backed by robust consumption and relatively low inflationary environment.
[21]
However, in FY19, economic prospects are fading
[22]
amid rising twin deficits, elevated inflationary pressures,
and corrective policy measures taken by the authorities to rein in macroeconomic
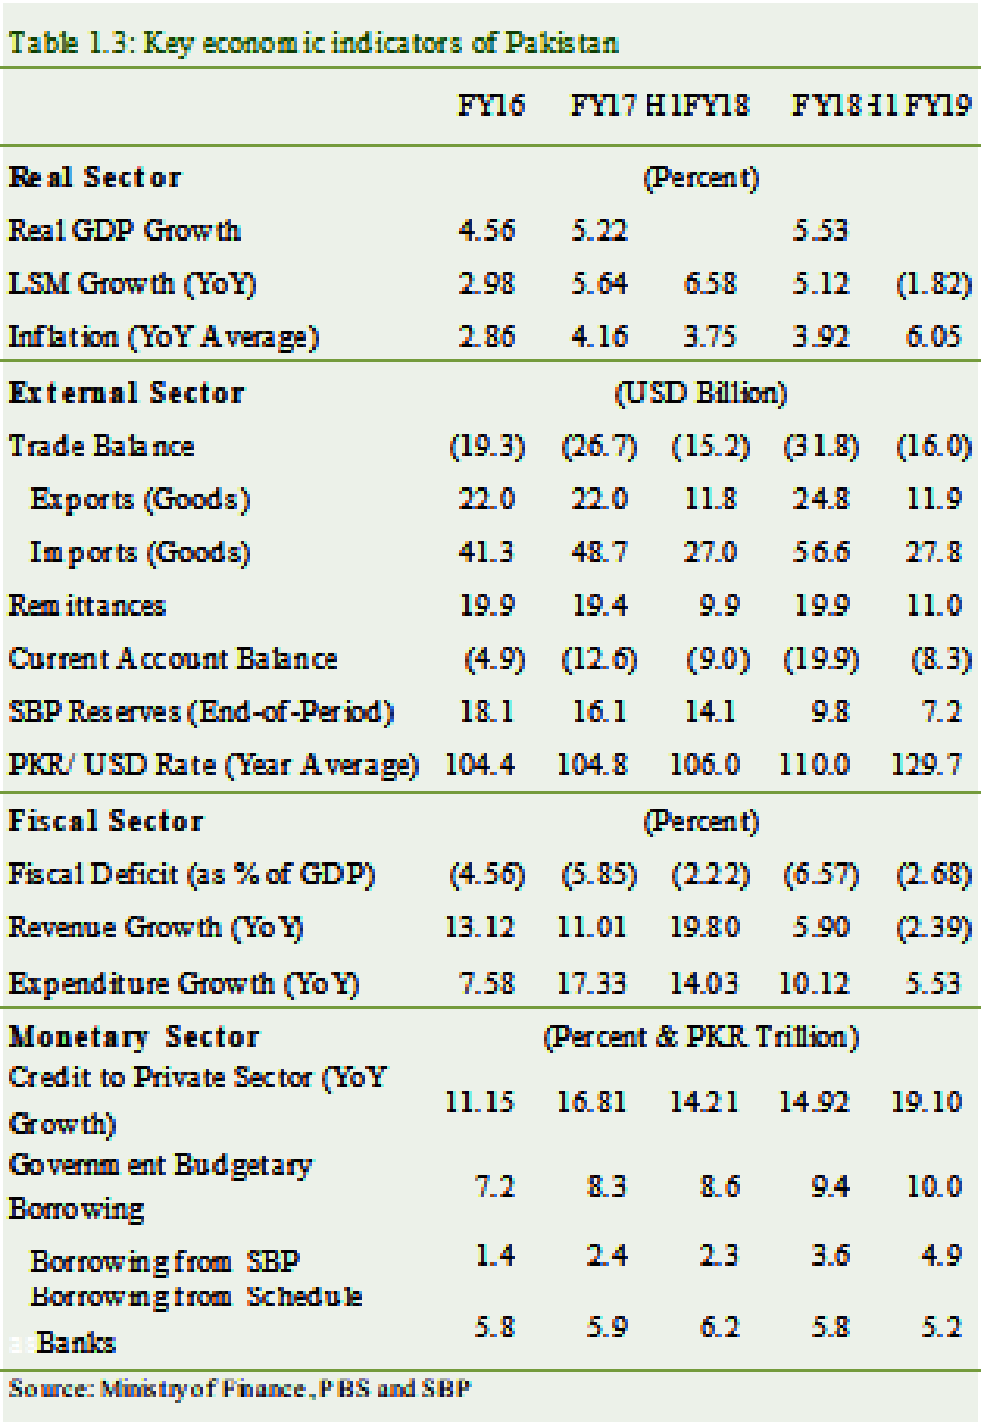
imbalances (Table 1.3)
External
account pressures remain instrumental risk to the growth
In FY18, current account deficit has been 57.65
percent higher than FY17. Resultantlyabsent matching inflowsSBP forex
reserves declined by USD 6.4 billion to reach USD 9.8 billion by Jun-2018.
The external account vulnerabilities have continued
into H1-FY19, despite marginal improvement in current account deficit.
Though pickup in workers remittances has provided some support, surge
in trade deficit has overshadowed this improvement. Particularly, increase
in international oil prices has led to rise in dollar value of imported
petroleum products and overall imports. This coupled with a meager increase
in exports has further worsened the trade deficit and curtailed the improvement
in current account deficit (Table 1.3).
[23]
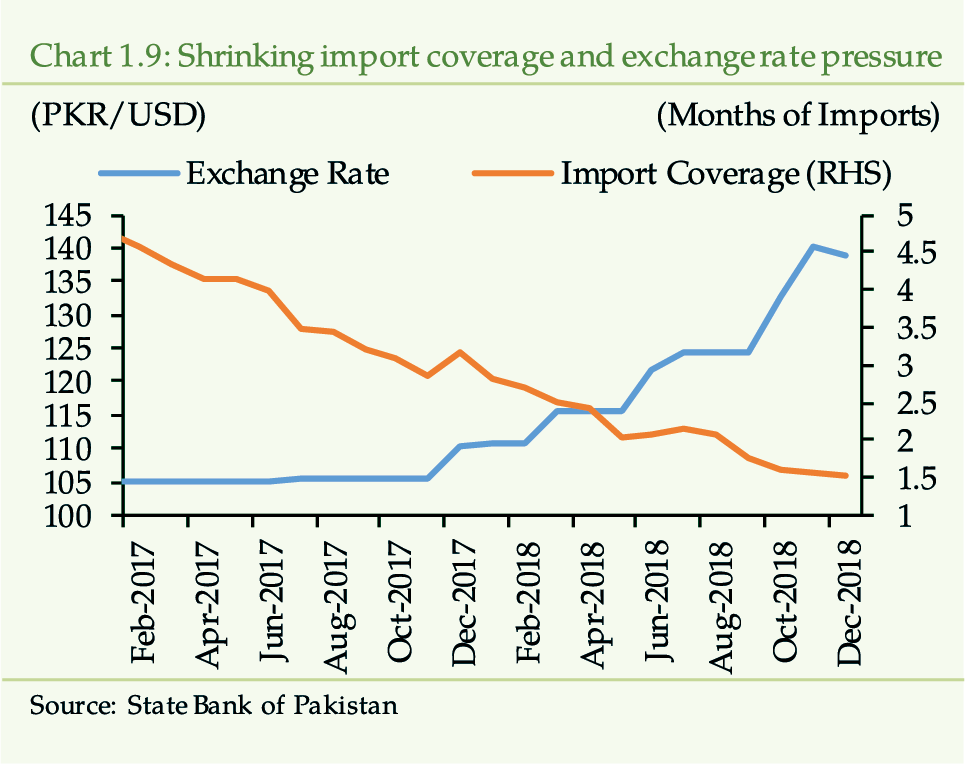
Consequently, SBPs forex reserves have further declined to
USD 7 billion by end Dec-2018; weakening the capacity to finance imports
and leading to depreciation of domestic currency (Chart 1.9).
During FY18 the fiscal deficit widened to 6.57
percent from 5.85 percent in FY17. The upswing in deficit has sustained
in H1FY19 despite cut in developmental spending. This increase has come
from significant rise in overall expenditures and contraction in revenue
collection. Resultantly, the revenue expenditure gap has widened leading
to higher fiscal deficit in the first half of the current fiscal year.
Consequently,
debt accumulates
The widening twin deficits have been financed
through increased borrowing from both the domestic and external sources.
As of end CY18, Pakistans gross public debt has reached to PKR 27 trillion
(equivalent to 71.21 percent of GDP).
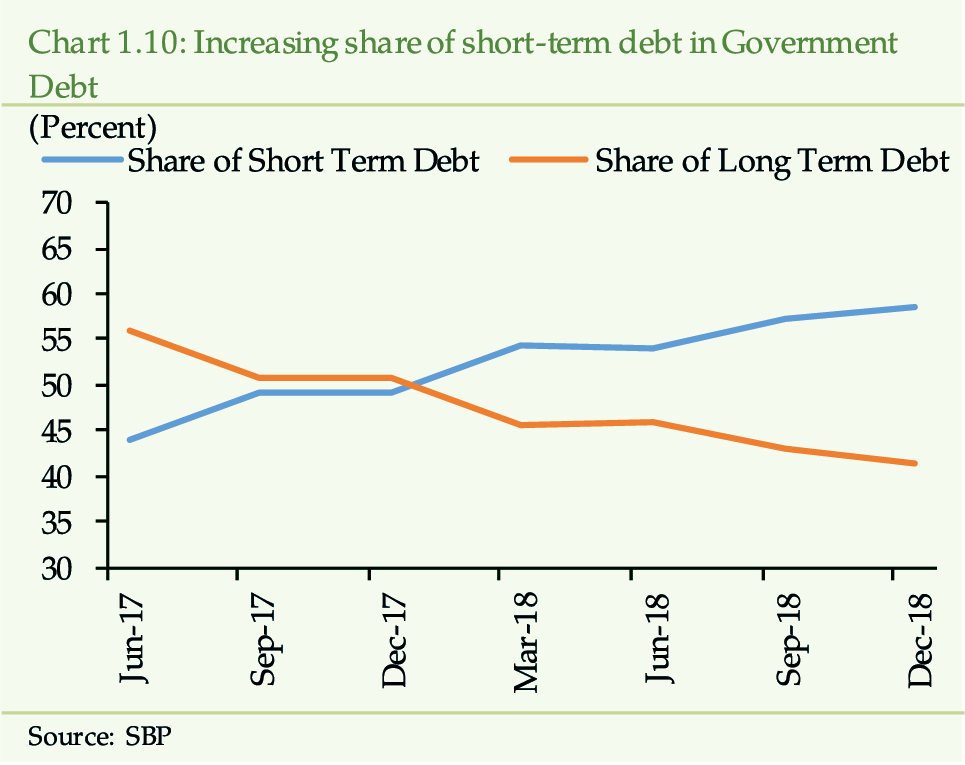
The domestic government debt has risen by 6.82
percent during H1FY19up from 3.96 percent in H1FY18. The dynamics of
domestic debt reveal that the debt structure has tilted towards short-term
maturity (Chart 1.10).
[24]
This concentration of debt at the lower end of the maturity
spectrum has exposed the government to rollover risk.
Besides, the government has heavily relied on
bilateral and commercial loans leading to higher accumulation of external
debt during H1FY19.
[25]
If the external account vulnerabilities persist, the foreign
debt is likely to accumulate to bridge the financing gap leading to weakening
in repayment capacity.
Besides
twin deficits, growing inflationary pressures remain a concern
.
Inflation began to rise since late FY18largely
due to demand pressuresand increased further during H1FY19. Average headline
inflation has risen to 6.05 percent in H1FY19up from 3.75 percent in
the comparable period of the previous year. More importantly, core inflation
(non-food non-energy) has increased to 8.0 percent in H1FY19 against 5.5
percent in H1FY18.
While demand pressures eased during H1FY19, rising
price level is driven by a number of factors encompassing; (1) PKR depreciation
(2) pass through of higher international oil prices to domestic consumers
(3) upward adjustment in gas and electricity tariffs (4) higher regulatory
duties on imports; and (5) increase in government borrowing from SBP.
[26]
The
Corrective policy measures are likely to contain domestic demand
Notable adjustment in the exchange rate (cumulative
depreciation of 23.61 percent in PKR), monetary tightening (425 bps rise
in policy rate), cut in PSDP expenditures
[27]
, asnd increased regulatory duties
[28]
on imports during CY18, indicate a combination of
policy measures taken to address the rising macroeconomic vulnerabilities.
The stabilization measures have had an impact on economic activity but
their full translation into moderation in aggregate demand may take some
more time.
Despite
monetary tightening, lending rates have been slow to respond
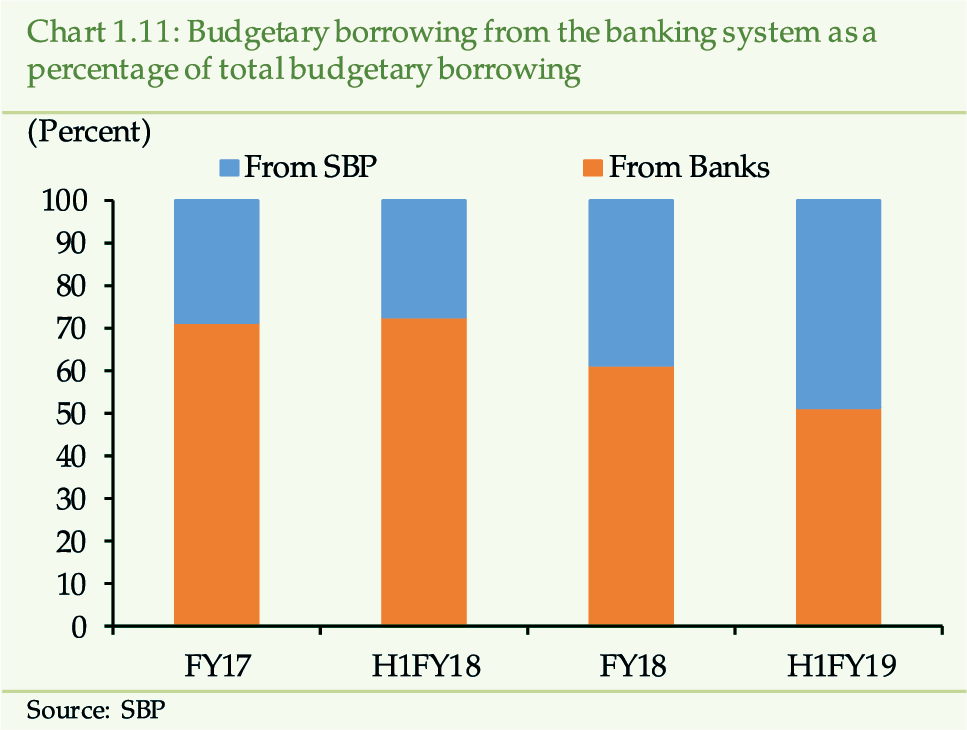
In CY18, the rise of 268 bps in weighted average
lending rates (WALR) despite
425 bps increase in policy rates indicate availability of ample liquidity
with the banks. The shifting pattern of the government budgetary borrowing
from banks
[29]
to SBP has improved banks liquidity which led lower increase
in WALR (Chart 1.11).
and
the private sector advances have continued to surge
In the wake of ample liquidity, the banking sector
has increased its lending to the private sector. The domestic private
sector advances have surged by 20.03 percent (YoY) during CY18 as compared
to 16.40 percent in the previous year. The robust increase in advances
has resulted from higher working capital needs. However, fixed investment
advances have decelerated to 8.25 percent during CY18 down from 14.97
percent in CY17. Moreover, the growth in private sector advances has been
broad-based as textile, energy, chemicals, cement sectors along with individuals
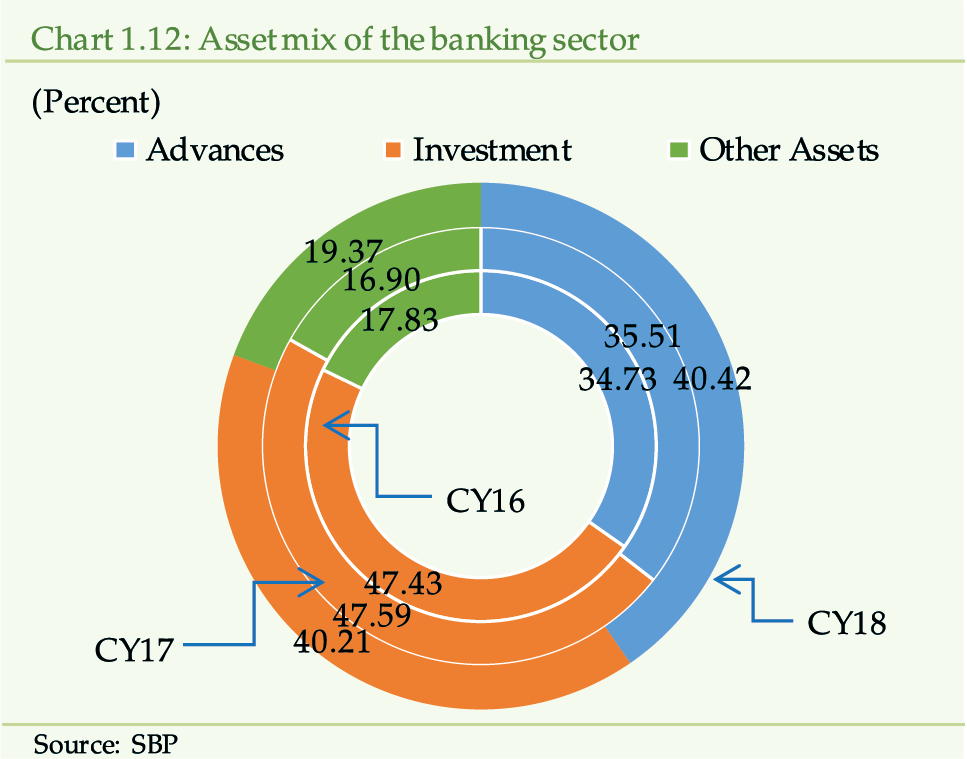
have availed advances (See Chapter 3.1).
Resultantly, the advances sharein total assetshas
risen to 40.42 percent in CY18 against 35.51 percent in CY17, while banking
sector exposure to the government securities has declined (Chart 1.12).
A
combination of higher interest rates and lower economic activity may undermine
the repayment capacity
The asset quality of the banking sector may come
under stress due to continued monetary tightening and receding economic
activity. With higher interest rates, re-pricing of existing loans could
increase the financial costs for the borrowers. This may weigh on repayment
capacity and earnings of the corporates, while hurting the profitability
of the banks due to higher provisioning expense (See Chapter 3.1 and
5).
The
domestic economy is likely to follow slow growth trajectory in the short-term
The much needed stabilization measures are expected
to further rein in aggregate demand and higher inflation. The resultant
slackness in economic activity would help abate the intensity of macroeconomic
imbalances in the external and fiscal sectors. Reaching an adequate level
of forex reserves seems to be the upfront challenge for favorable investor
sentiments and lower risk perceptions.
[1]
International Monetary Fund. (2019). World Economic Outlook.
Washington, April.
[2]
In the wake of trade restrictions imposed since the start of
2018, the import of goods in the US and Chinese economies has declined
by about 12 percent and 6.5 percent, respectively. World Bank. (2019).
Global Economic Prospects. Washington, January.
[3]
Organization for Economic Co-operation and Development (2019).
Interim Economic Outlook. France, March.
[4]
International Monetary Fund. (2018). World Economic
Outlook. Washington, October.
[5]
International Monetary Fund. (2019). World Economic Outlook.
Washington, April.
World Bank. (2019). Global Economic Prospects.
Washington, January.
[6]
Yield on EMDEs sovereign bonds has risen by 140
bps in 2018.
[7]
International Monetary Fund. (2019). World Economic Outlook.
Washington, April.
[8]
IMF. (2018). Global Financial Stability Report. Washington,
October.
[9] Debt levels have reached to its historically highest level of USD 34 trillion (over 253.40 percent of GDP) as of Q1CY18, compared to USD 6 trillion (145.80 percent of GDP) in Q1CY08 (Source: BIS.
https://stats.bis.org/statx/srs/table/f1.2)
[10]
Reserve Bank of Australia. (2018). Financial Stability
Review. October.
[11]
For example, the positive market expectation surrounding the
trade talks between China and the US.
[12]
World Bank. (2019). Global Economic Prospects. Washington,
January.
[13]
Kopp, E. & Williams, P. D. (2018). A Macroeconomic Approach
to Term Premium, Working Paper No. 18/140, International Monetary Fund.
[14]
According to OECD database: Consumer price indices (CPIs) of
OECD reached to 3.1 percent level in October 2018 and sharply reversed
back to 2.1 in January 2019- on the back of lower energy prices.
[15]
In October 2018, average oil price jumped to USD 80 per barrel,
achieving its peak since November 2014. The prices increased due to supply
side factors, including a decrease in supply from Iran following the US
sanctions and a fall in Venezuelas production. However, in recent months,
oil prices have declined sharply and have settled around USD 58 a barrel.
The decision by Organization of Petroleum Exporting Countries (OPEC) and
Non-OPEC exporters not to cut production and the waiver given by the US
from sanctions to eight countries to continue importing Iranian oil has
led to this development.
[16]
In 2018, escalating trade tensions, concerns about possible
rise in inflation due to strong wage growth in the US and hike in federal
funds rate resulted in bouts of volatility across the globe in the early
(February and March) and later (October to December) part of the year.
[17]
Standard valuation metrics suggest that equity prices in the
USA are hovering at levels significantly above its historical norm. (Source:
ECB. (2018) Financial Stability Review. November)
[18]
Source: BIS Database (About two-third of the total debt is
held by private sector and the rest is public debt)
[19]
For instance, the average exposure of European insurers to
BBB-rated corporate and sovereign bonds increased from about 5 percent
to more than 20 percent from 2008 to 2017 (Source: Global Financial Stability
Report (April-2019).
[20]
International Monetary Fund. (2019). World Economic Outlook.
Washington, April.
[21]
In FY18 consumption expenditure have increased by 7.23 percent
[22]
Large Scale Manufacturing (LSM) growth has turned negative
to 1.82 percent during H1FY19 against 6.58 percent expansion in H1FY18.
[23]
State of Pakistans Economy Second Quarterly Report
2018-19
[24]
In rising interest rate scenario, banks have been reluctant
to invest in long-term PIBs due to anticipated revaluation losses. Therefore,
banks demanded higher return on long-term investments and kept their interest
in TBills.
[25]
Governments external debt has increased by USD 1.4 billion
during H1FY19 reaching to USD 66 billion by the end of Dec-2018.
[26]
Monetary Policy Statement during H1FY19.
[27]
PSDP expenditures during H1FY19 have declined by 36.86 percent.
[28]
State of Pakistans Economy Second Quarterly Report 2018-19
[29]
On net basis the government retired PKR 1073 billion to the
banking sector.
Deteriorating
economic conditions and uncertainty among market participants about future
economic direction have kept the financial markets under stress. The forex
and equity markets have witnessed higher volatility in CY18, while the money
market has remained calm. The dearth of US dollar liquidity in the domestic
economy has been an important aspect of markets behavior and the associated
spillover effects. Going forward, the stability of the financial markets
largely depends upon the intended outcome of the corrective policy measures
taken to address the economic imbalances.
Vulnerabilities
might be building up in the global financial markets
In recent years, global valuations across a broad
range of asset classes (equities and bonds)driven by strong global growth,
low inflation and largely accommodative monetary policieshave remained
high. The rising asset prices along with lower volatility, growing leverage
in non-financial sector and continued deterioration in under-writing standards
represent build-up of significant financial vulnerabilities.
[1]
,
[2]
In 2018, escalating trade tensions, concerns about
possible rise in inflation due to strong wage growth in the US and measured
hike in federal funds rate resulted in bouts of volatility in the 1st
and 4th quarter of the year. (See Chapter 1.) However,
the financial conditions have remained relatively easy in Advanced Economies
(AEs), mainly US and EU, which have contributed
to further buildup of financial vulnerabilities.
As far as the vulnerabilities in the Emerging Markets
and Developing Economies (EMDEs) are concerned, they remain moderate at
large. For some EMDEs (e.g. Turkey and Argentina), however, the stress
[3]
has risen due to higher external leverage, weak policy buffers,
geopolitical tensions, and escalated trade tensions. The jittery sentiments
in such markets have not spread to other EMDEs because the country-specific
factors seem to be instrumental in investors decisions.
[4]
Going forward, further escalation of trade dispute
between the USA and China, geopolitical risks, and any negative growth shock
could lead to widespread volatility, higher risk premia, re-pricing in financial
assets and increased financial system stress at the global level. The monetary
policy direction in AEs, especially in the US, also remains a key risk factor
in this regard.
Volatility
in domestic financial marketsdriven by idiosyncratic conditionshas risen
in CY18
In CY18, rising twin deficits, inflationary pressures
and uncertainty among market participants about economic outlook has translated
into higher volatility in the forex and equity markets (Chart 2.1). The
exchange rate has cumulatively depreciated by 23.61 percent against the
US dollar in CY18. In similar vein, domestic equity market was down by 7.58
percent (on average). Accordingly, stress in financial markets
[5]
has risen to higher level (Chart 2.2). However, volatility
in money market, on average, has remained contained due to interest rate
corridor mechanism in place, prudent management of market liquidity by SBP
and better liquidity conditions prevailing in the last quarter of the year.
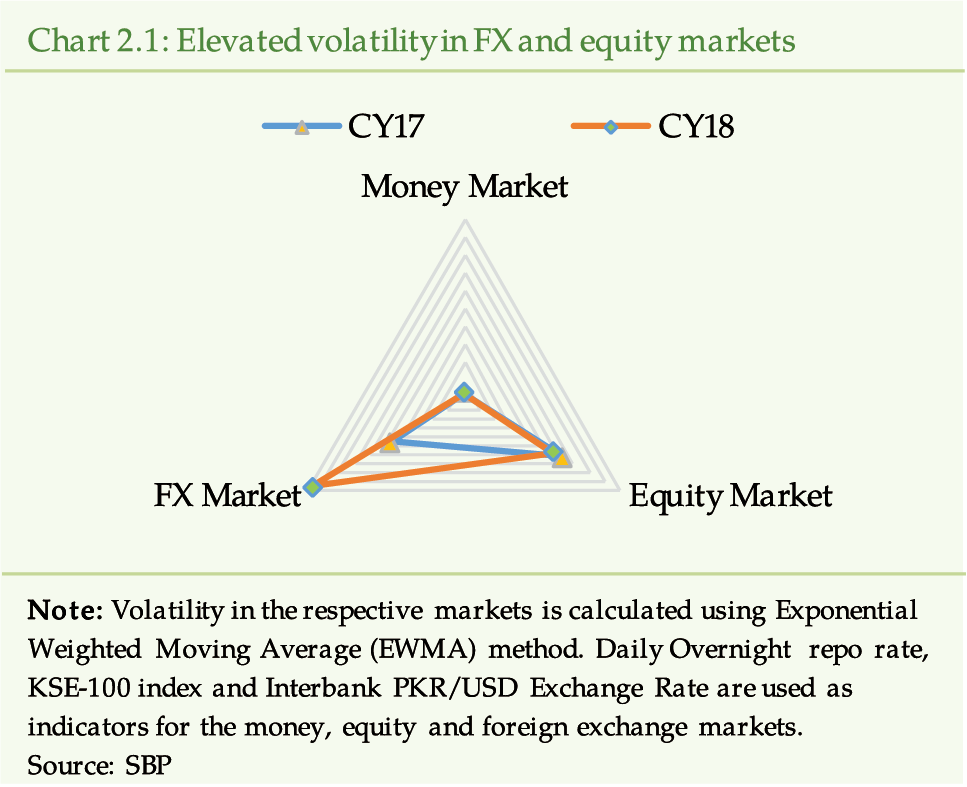
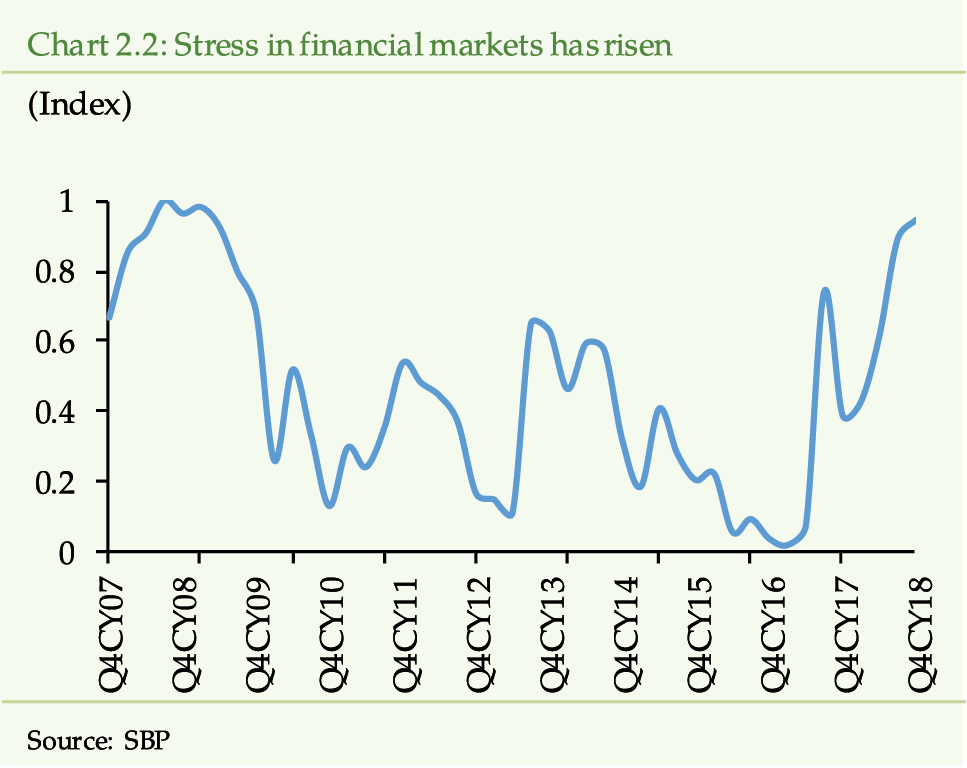
Rising
current account deficit leading to depreciation of domestic currency
The continued surge in trade deficit
[6]
during CY18 has resulted in surge in the current account deficit,
which contracted the SBP foreign exchange reserves by USD 6.9 billion to
reach USD 7.2 billion or equivalent to 1.5 months of imports. (Chart
2.3). Because of weakening in capacity to finance imports, PKR has cumulatively
depreciated by 23.61 percent
[7]
during CY18. Resultantly, volatility in the inter-bank forex
and open markets has risen to a notable scale (Chart 2.4a & b).
In addition, the average spread (between open market and the inter-bank
exchange rates) during CY18 has remained at PKR 1lower than PKR 2 in CY17,
suggesting increased synchronization between interbank and open markets.
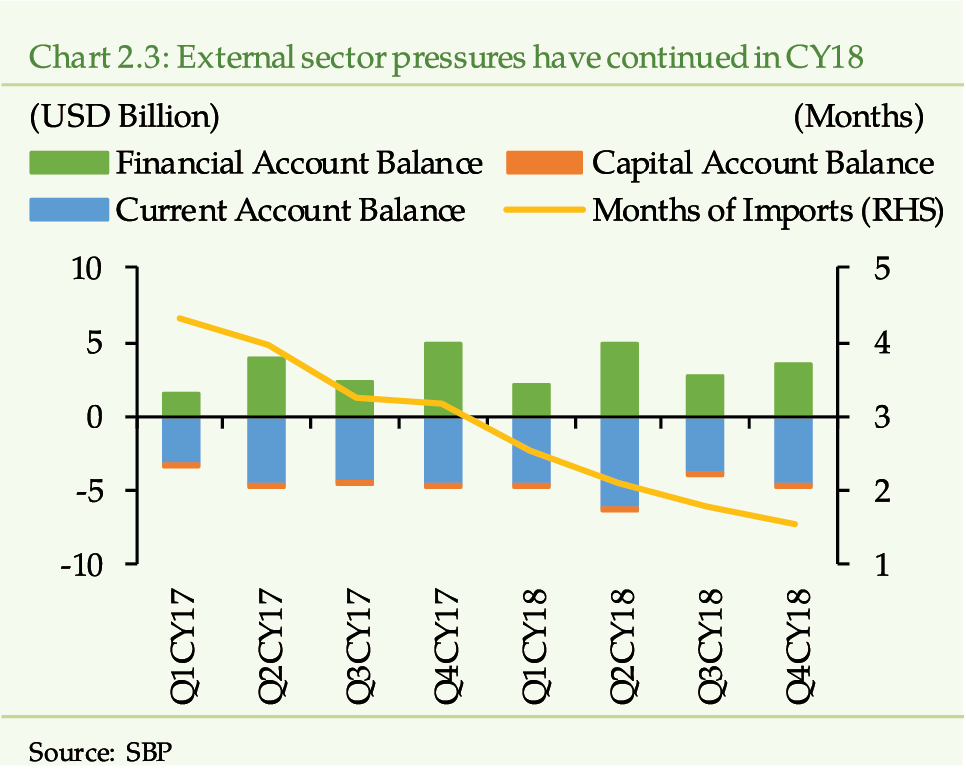
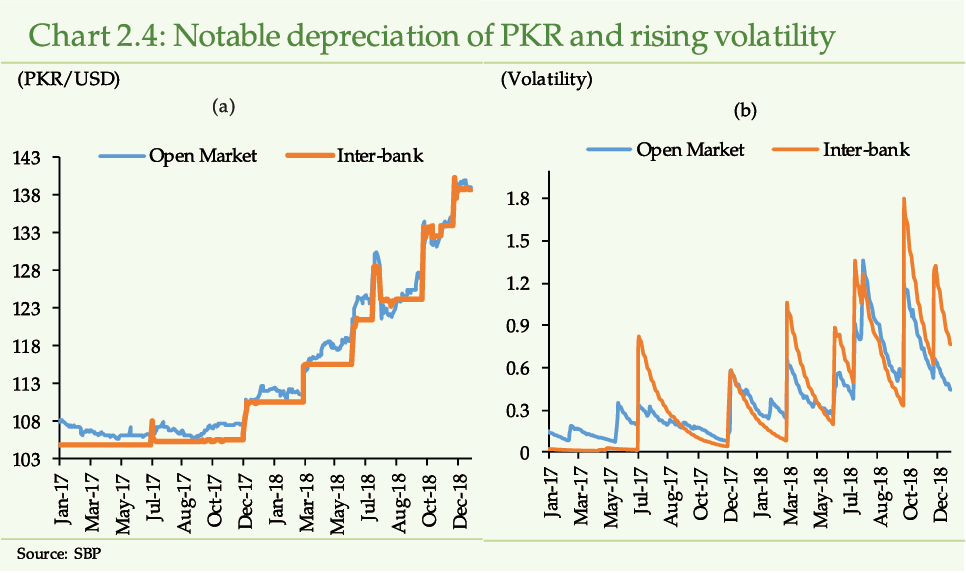
Changing
exchange rate dynamics have influenced economic agents behavior
The notable adjustment in exchange rate has affected
price and volume of short-term and long-term financial instruments, respectively.
Lower interest rates differential kept the forward premium/Swap points
[8]
a short-term forex instrument lower during H1CY18 as compared
to the previous year (Chart 2.5a, 2.6a).
[9]
However, in H2CY18despite notable interest rate spread between
domestic and international interest ratesforward premium has remained compressed
(Chart 2.5b). This indicates higher demand for US dollars in the
domestic market due to increase in external sector vulnerabilities.
[10]
(Chart 2.6b)
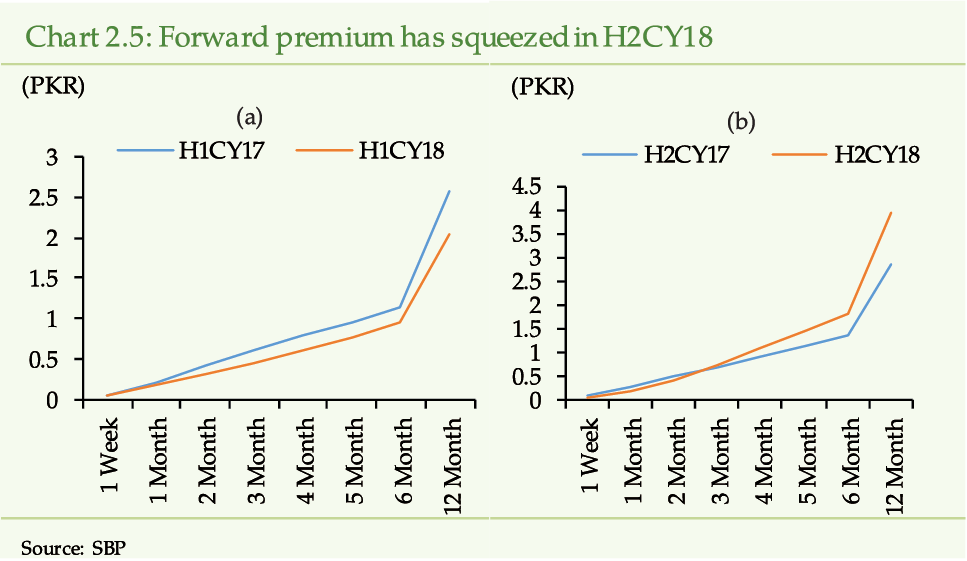
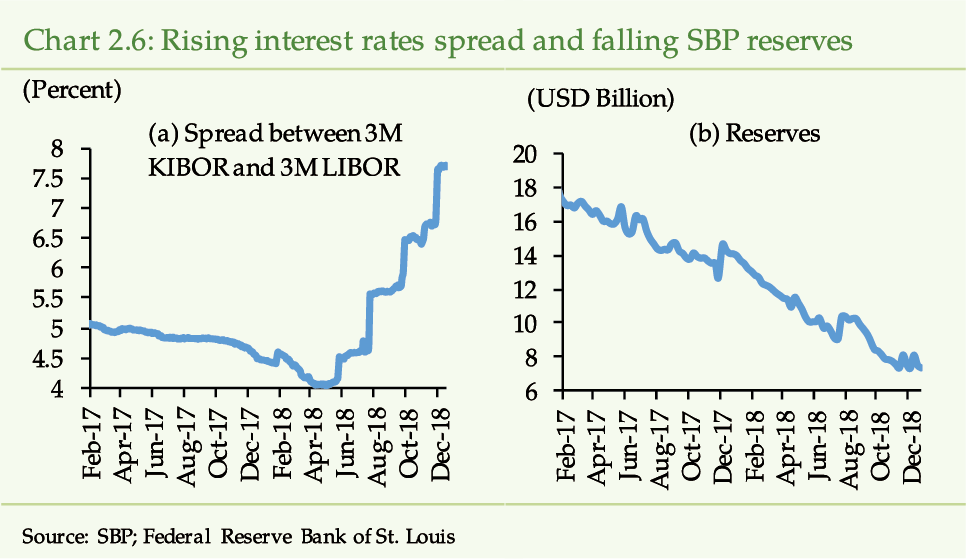
Similarly, in case of longer-term financial instruments
(such as the derivatives) a compositional change is quite apparent. While,
in CY17, most of the derivative deals comprised of interest rates swaps
(IRS),
[11]
the cross currency swaps (CCS)
[12]
have dominated the derivative market transactions in CY18.
[13]
This reflects the rising tendency of the market participants
to hedge themselves against the growing exchange rate risk.
Besides influencing the price and volume of financial
instruments, the changing exchange rate dynamics may alter the borrowing
pattern of businesses as well. When a firm envisages expansion, it takes
into account exchange rate dynamics to determine its cost of imports. In
times of rising forex market volatility, the investors long-term financing
appetite, generally, dwindles. This may be evident from the decelerating
private sector fixed investment advances that expanded by 8.25 percent in
CY18down from 14.97 percent growth in CY17 (Chart 2.7a). Moreover,
in volatile times, pricing of foreign currency loans becomes expensive and
demand recedes. The abating level of foreign currency loans confirms this
assertion. (Chart 2.7b). Therefore, the stability in the FX market
is important for increased business confidence.
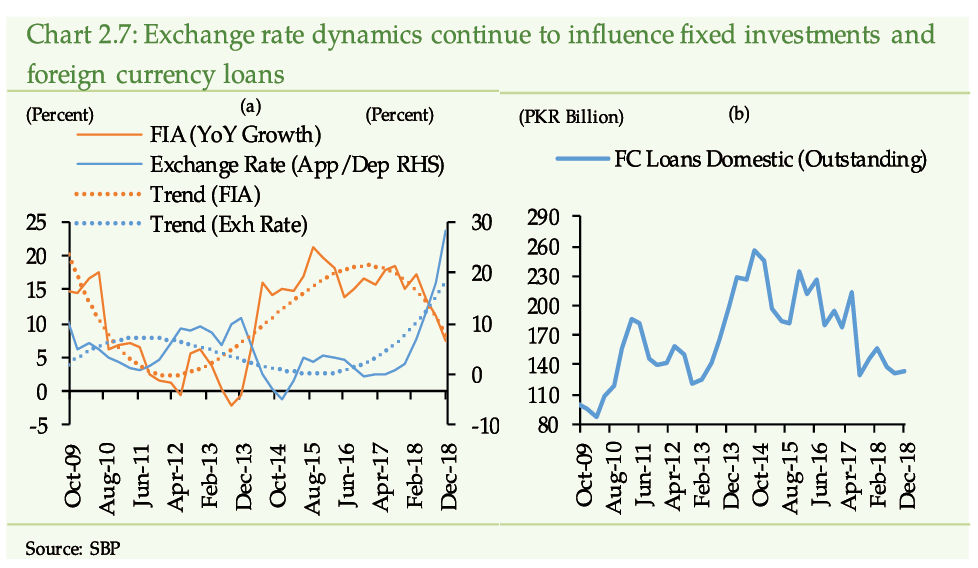
Interest
rates at the short-end of the yield curve have moved up in tandem with monetary
policy tightening
.
The policy rateafter remaining unchanged since
Jun-16began to move up in Jan-18. Rising inflationary pressures and higher
fiscal and current account deficits explain the successive increases in
policy rate during CY18 (Chart 2.8). Cumulatively, policy rate has
risen by 425 basis points to reach at 10.0 percent in Dec-18. Accordingly,
the short-term interest rates on government securities have inched up in
the secondary market (Chart 2.9a).
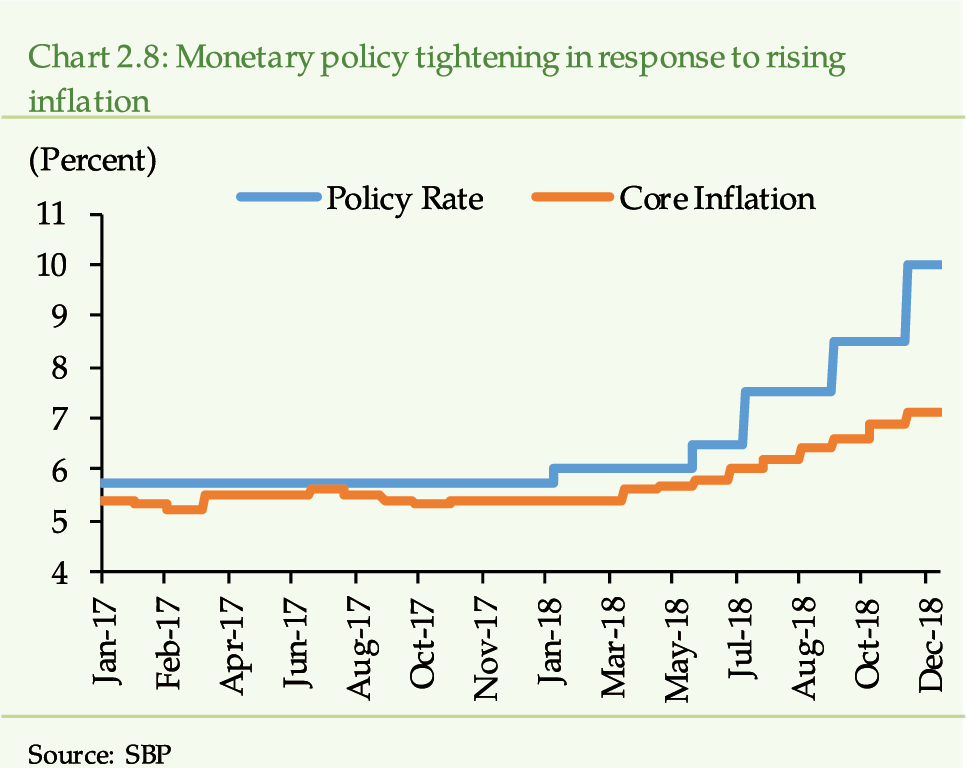
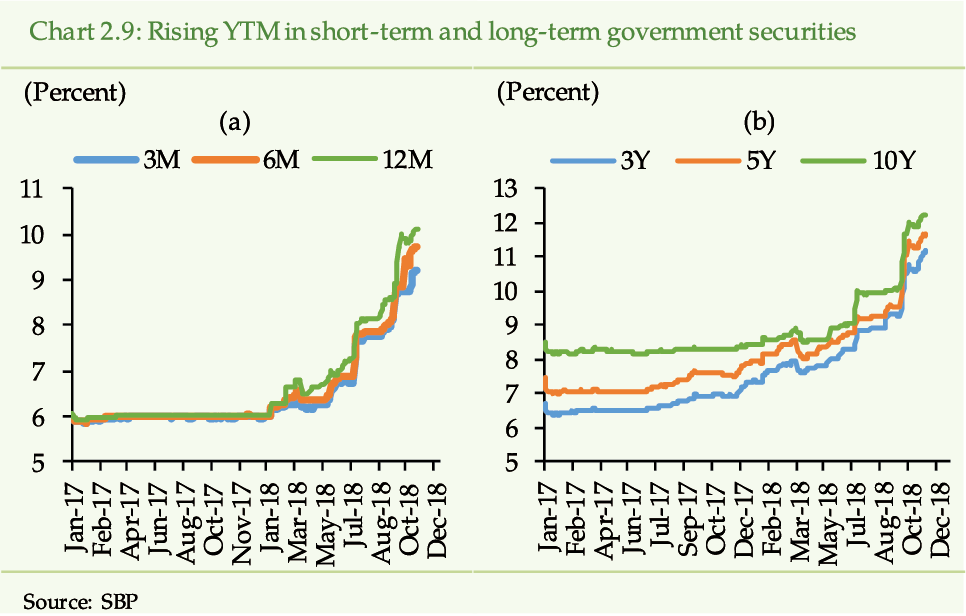
and
the interest rates at the long-end of the yield curve have inched up
In CY17, yield on long-term government securities
averaged at 7.38 percent. With rise in policy rate in CY18, average yield
has increased by 200 basis points to 9.35 percent (Chart 2.9b). However, in perspective of
term premium
[14]
, the yield on long-term securities has risen to a lesser extent
as compared to the short-term securities. As a result, the term-premium
is trending downwards. This may suggest less than optimistic expectations
of market participants about the future economic prospects.
In the secondary market, most of the trading activity
of government securities during CY18 has taken place in maturities of up
to 3 months, mirroring the primary market developments (increasing interest
in short-term securities by market participants) (Chart
2.10). Thin trading in longer-term maturities may undermine their true
price discovery, besides reflecting the risk averse behavior of market participants.
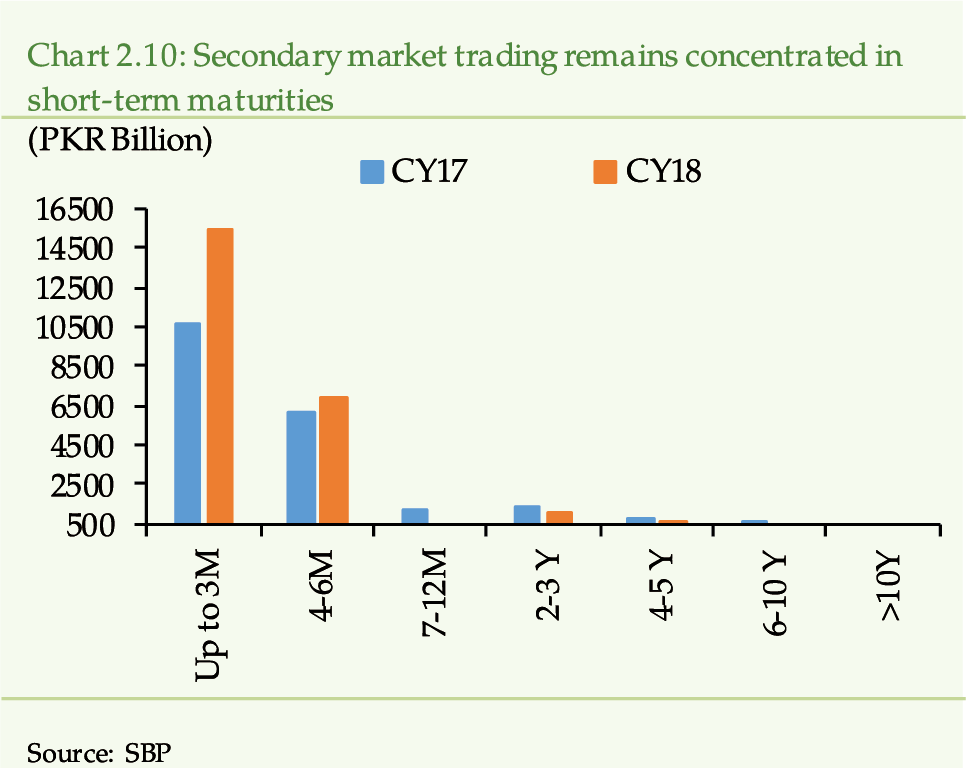
Governments
borrowing pattern as well as markets bidding behavior have remained key
drivers of money market volatility
In CY18, overnight repo rate, on average, has been
one basis point above the policy rate (versus 7 basis points higher in CY17).
The average volatility has also remained at a lower level in CY18 compared
to CY17. However, dynamics of the overnight repo rate during the year reveals
thatfrom Apr-18 to Aug-18volatility has remained high and it declined
only towards the end of CY18 (Chart 2.11).
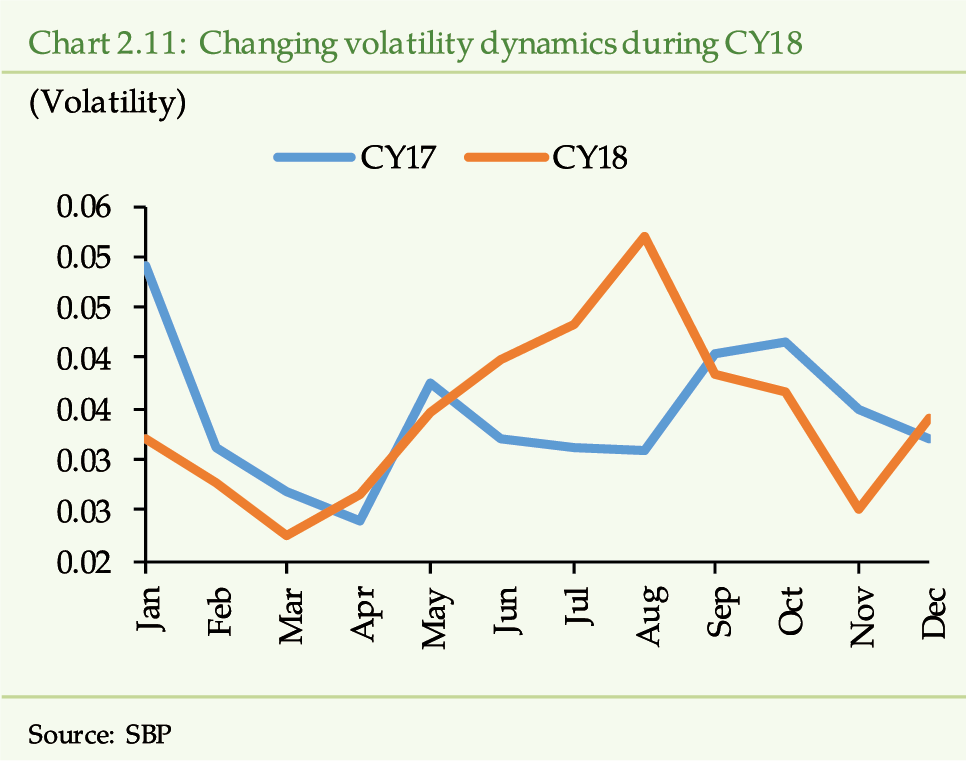
The liquidity conditions in the money market are
strongly influenced by the governments institutional choice for budgetary
borrowings as well as market participants appetite for government bonds.
Due to transition in government during the mid of the year, consistency
in choice of government borrowing has been effected, which increased uncertainty
and volatility in the market during Apr-Aug 18. Moreover, during the same
period, banks have not been a willing lender to the government, which added
to the volatility.
Moreover, SBP has had to calibrate its market interventions according to the liquidity conditions existing in the market (Chart 2.12 and 2.13). It has made injections until Aug 18 and thereafter mostly mop-ups. It is interesting to note that despite injections during Apr-Aug 18, the money market has remained volatile, due to governments borrowing pattern.
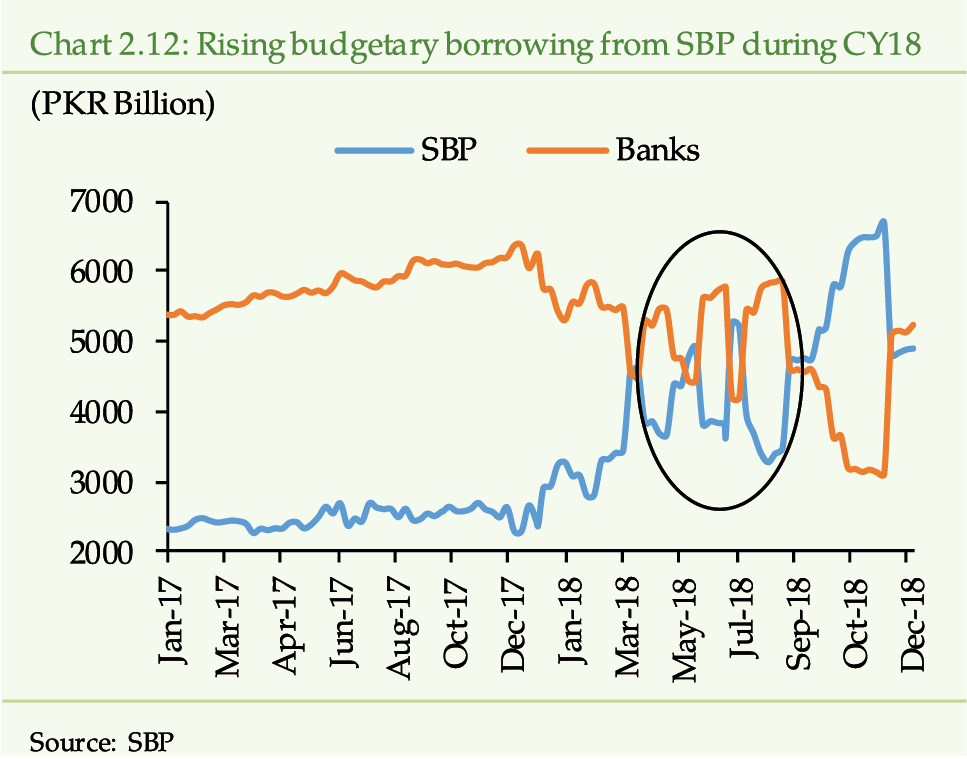
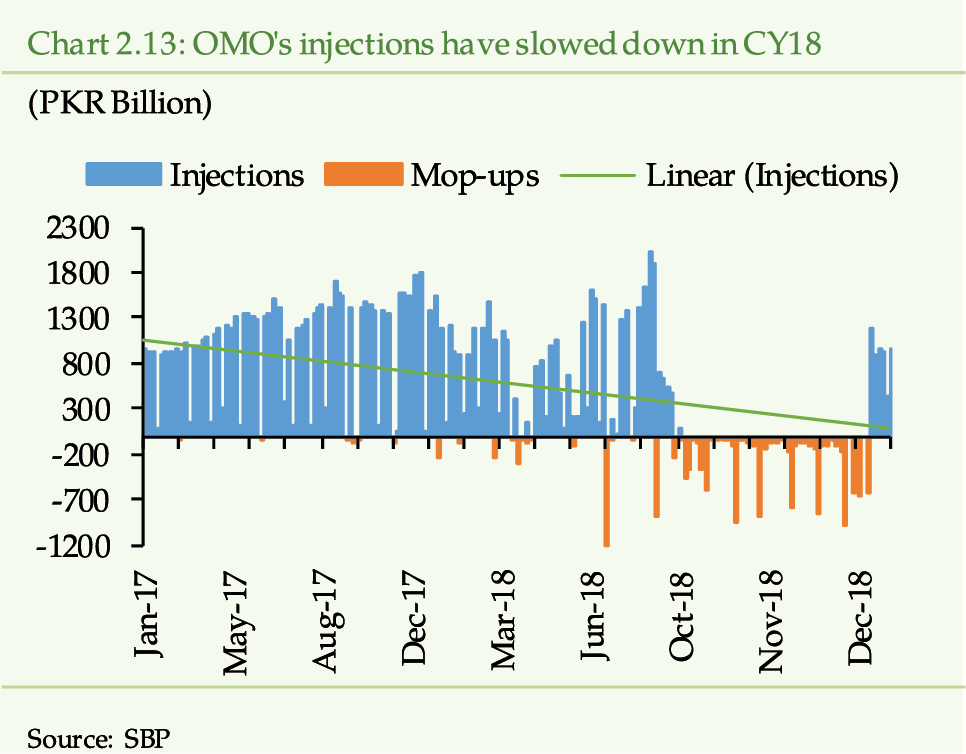
Banks
increasingly invested in short-term treasury bills
The analysis of primary market reveals that the banks have been actively participating in 3 months treasury bills auctions since latter half of CY17, while their participation in 6 months and 12 months treasury bills auctions have remained negligible (Chart 2.14). [15] , [16] This is mainly due to higher interest rate expectationsa fact corroborated by decreasing interest of banks in long-term government securities (PIBs). The banks have not only demanded higher returns on PIBs during CY18 but have also offered lower amounts (Chart 2.15). [17] This also suggests that the formation of higher interest rate expectations by the market participants began a few months prior to the monetary policy tightening.
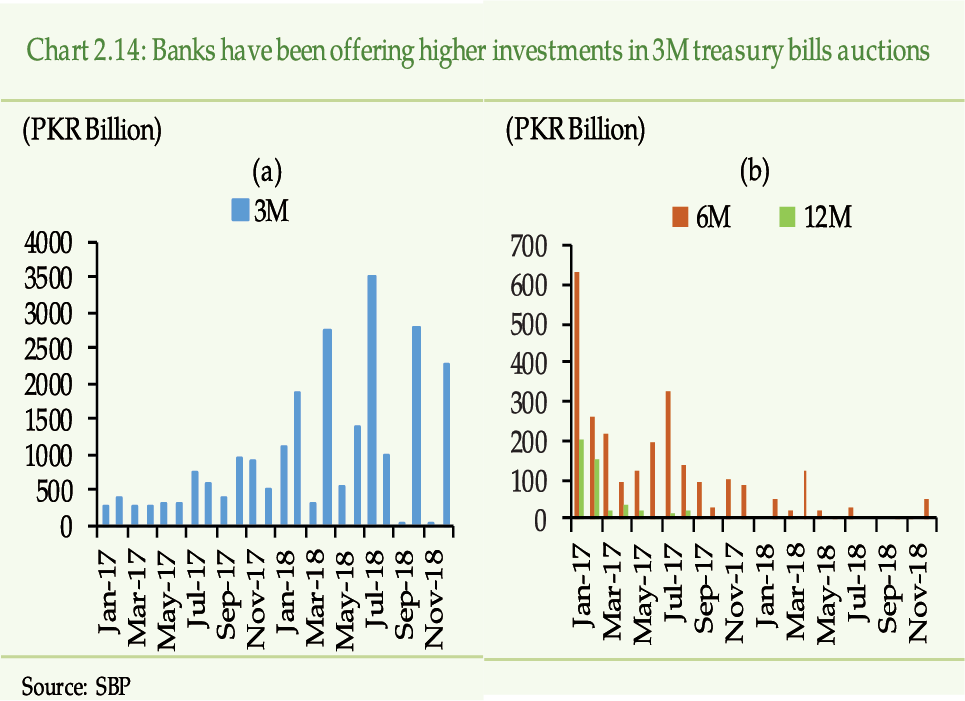
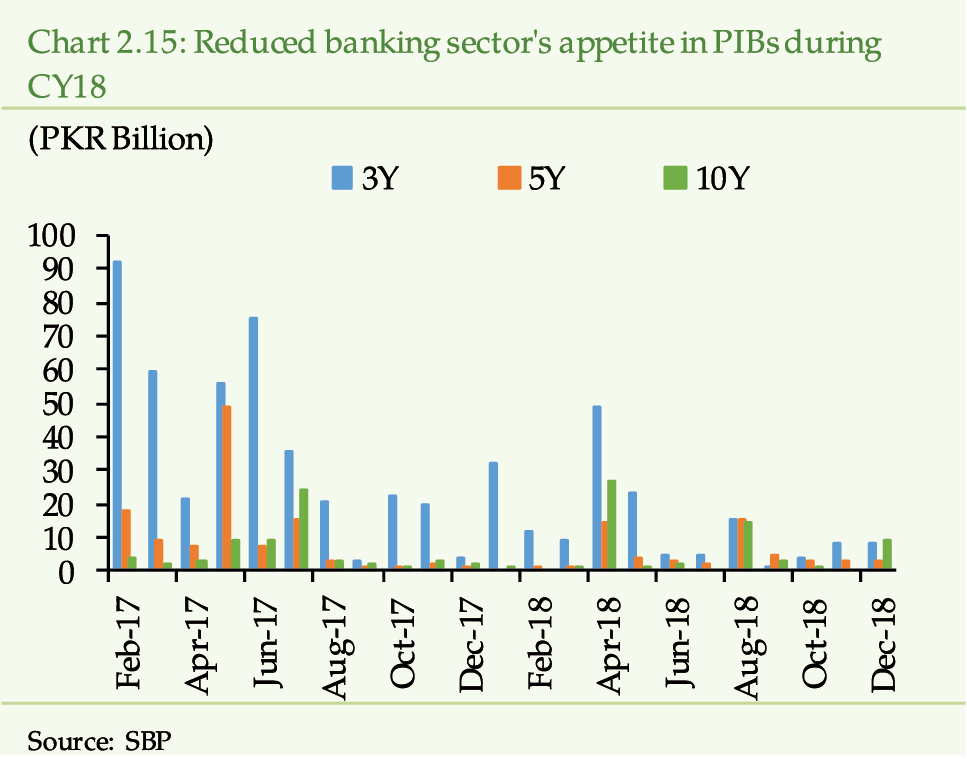
leading to higher rollover risk for
the Government
Banks interest in short-term government securities
have led to further increase in rollover risk for the government
[18]
. The share of MTBs in total government debt from the banking
sector has increased to 65.86 percent in Dec-18 from 57.06 percent a year
ago, while that of PIBs has declined to 28.07 percent in Dec-18 from 37.17
percent in Dec-17 (Chart 2.16).
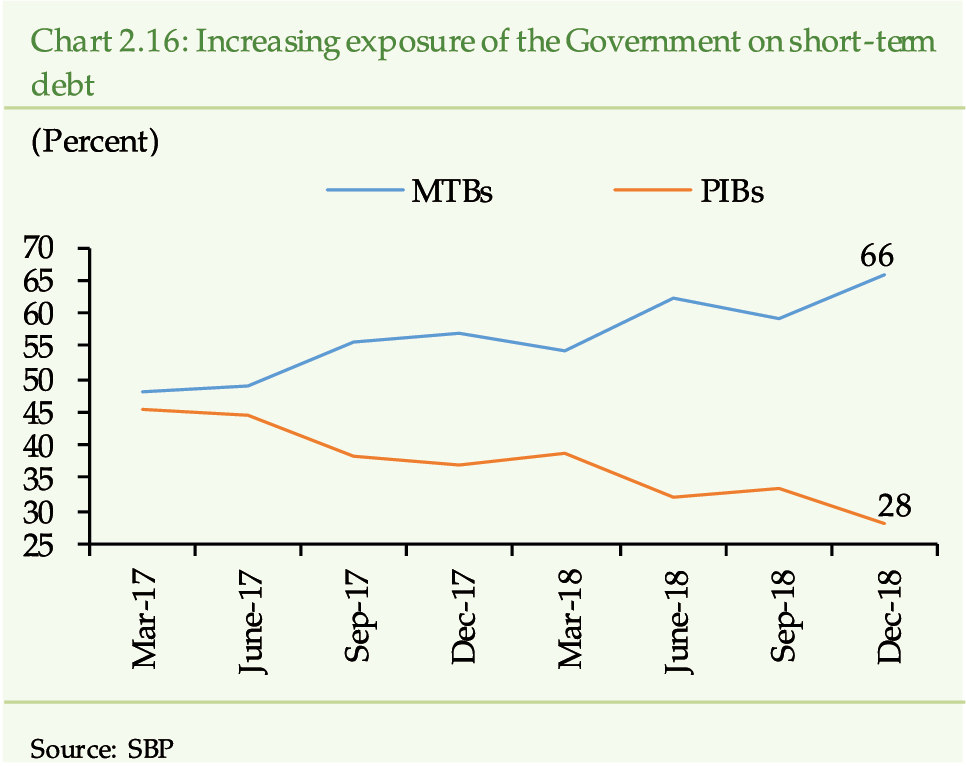
The
equity market valuation is trending downwards
In CY18, equity marketdown by 7.58 percent on
averagehas remained bearish and range bound (Chart 2.17). Tightening macrofinancial
conditions (rise in interest rates, exchange rate depreciation, inflationary
pressures etc.), uncertainty (arising from political transition), and net-foreign
outflows in response to persistent increase in the Federal funds rate have
contributed to the equity market slowdown. As a result, the market capitalization
has reduced by 10.25 percent during CY18 (versus 10.98 percent decline in
CY17) (Table 2.1).
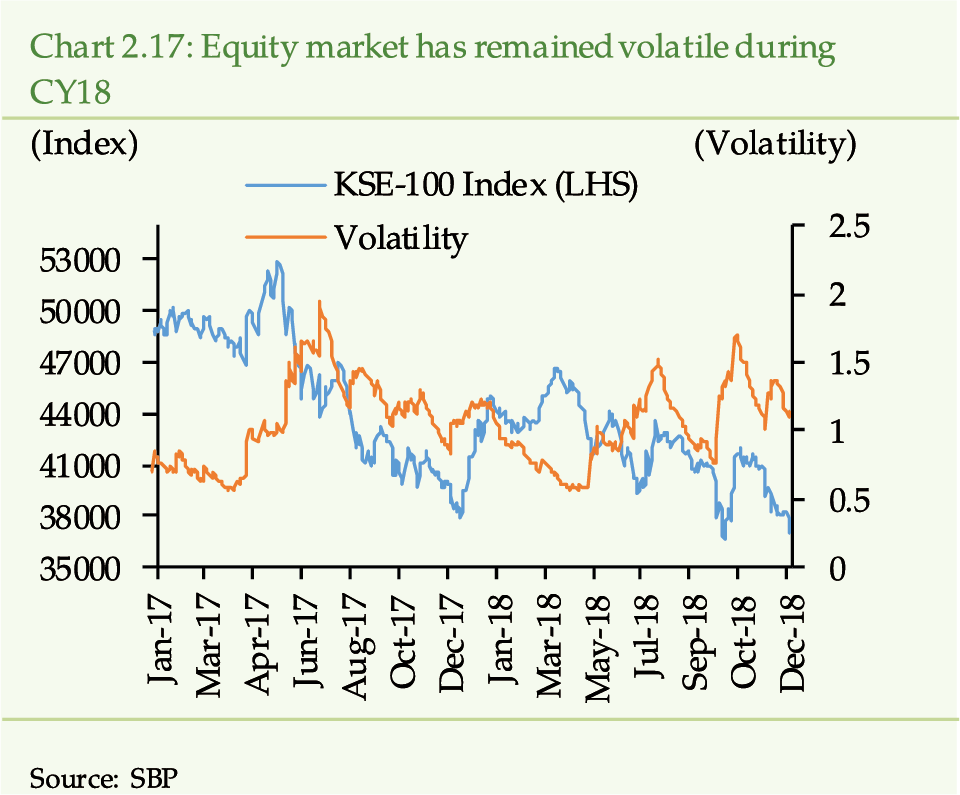
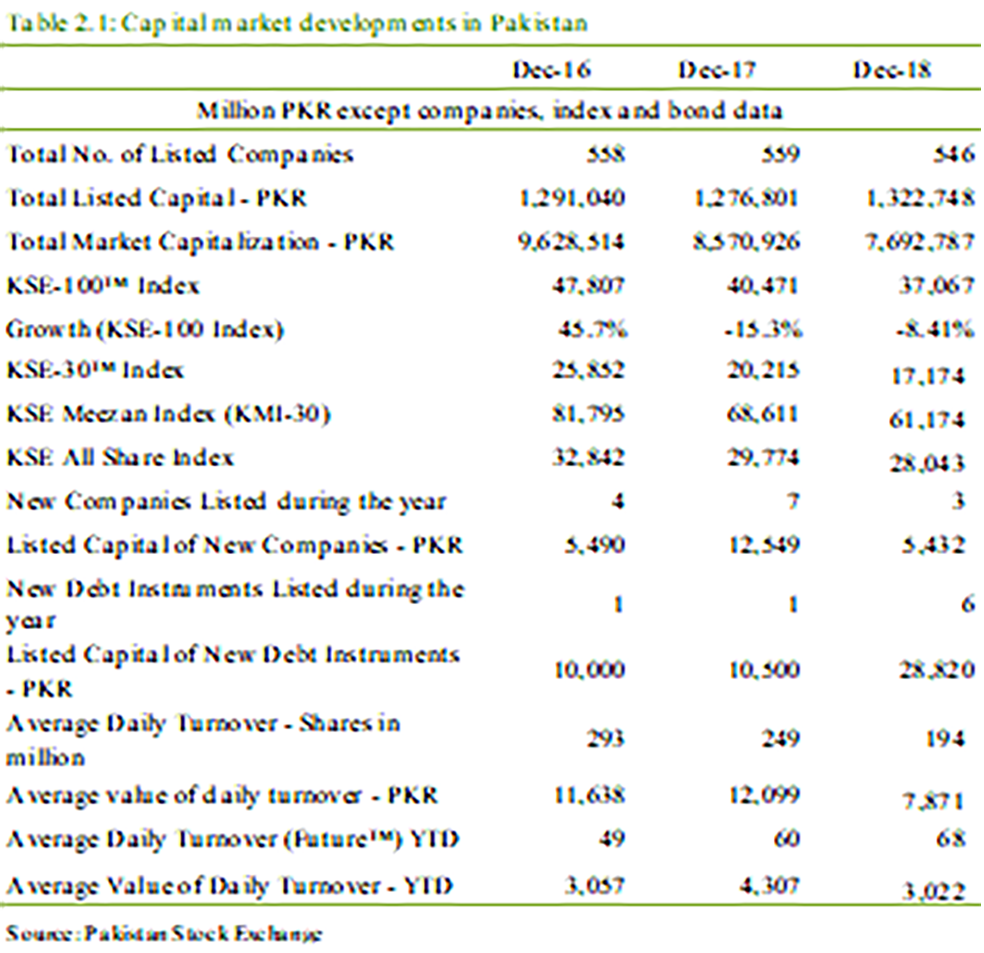
The corporate profitability has also come under
pressure as their earnings
[19]
growth declined to 2.91 percent in CY18 from 18.77
percent a year earlier.
[20]
(See Chapter 5). This along with PKR depreciation has
resulted in reduced dividends (USD 1.9 billion in CY18 versus USD 2.4 billion
in CY17) on foreign portfolio (in dollar terms) and inflow of direct investments.
With decline in market prices and the corporate earnings, the average Price-to-Earnings
ratio (P/E) has also reduced to 9.24 in CY18 against 10.18 in CY17. (Chart
2.18). Further, the investors became risk averse and refrained from
taking aggressive positions, which has squeezed trading volume in equity
to 194 million shares in CY18 against 249 million shares in CY17 (Chart
2.19).
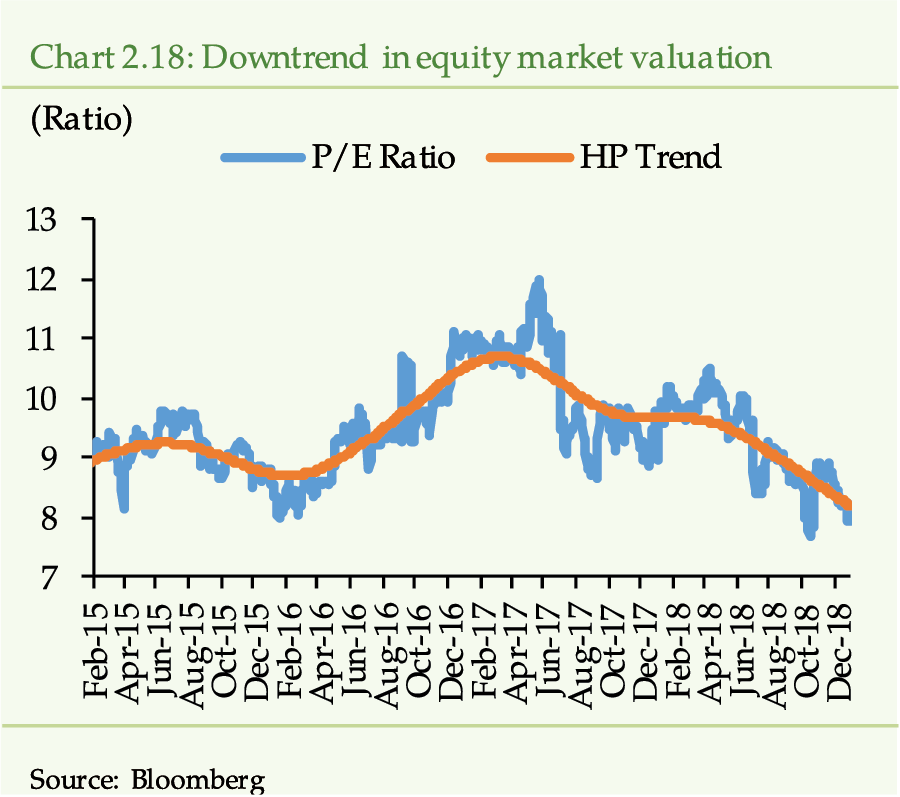
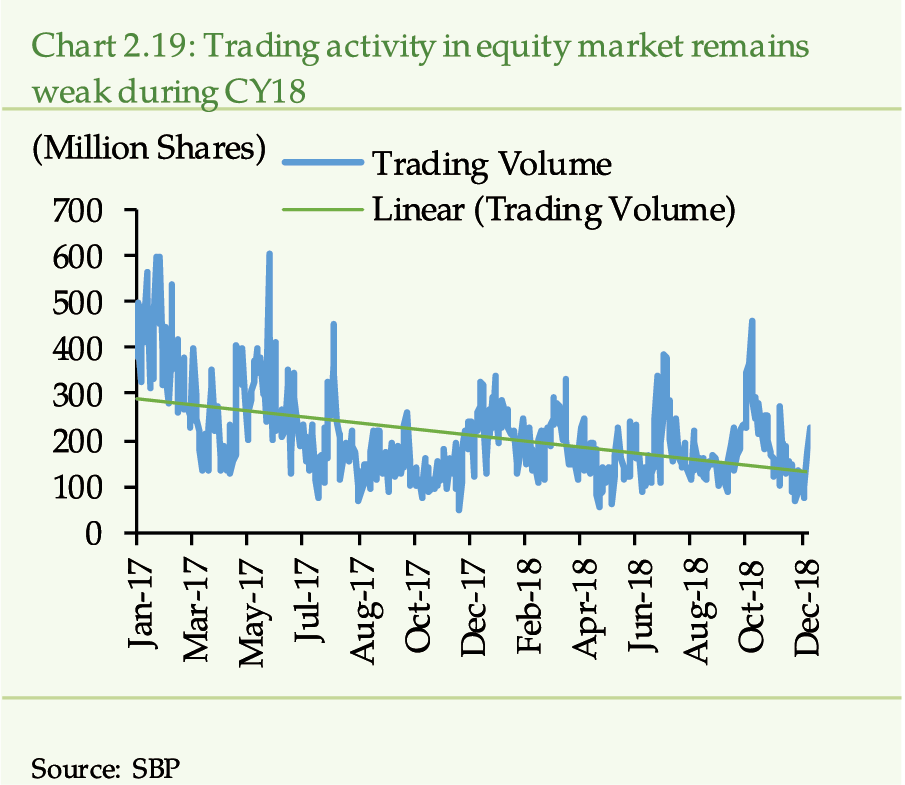
leading
to increase in risk aversion
The narrowing gap between earnings yield [21] in equities and risk-free money market instruments in CY18 has compounded the risk averse behavior (Chart 2.20). This is evident from the changing composition of asset portfolio held by the mutual funds. The share of money market assets (in total assets) has increased to 27.67 percent (17.42 percent in Dec-17), while the exposure to equity market has declined to 37.43 percent (41.90 percent in Dec-17) (Chart 2.21).
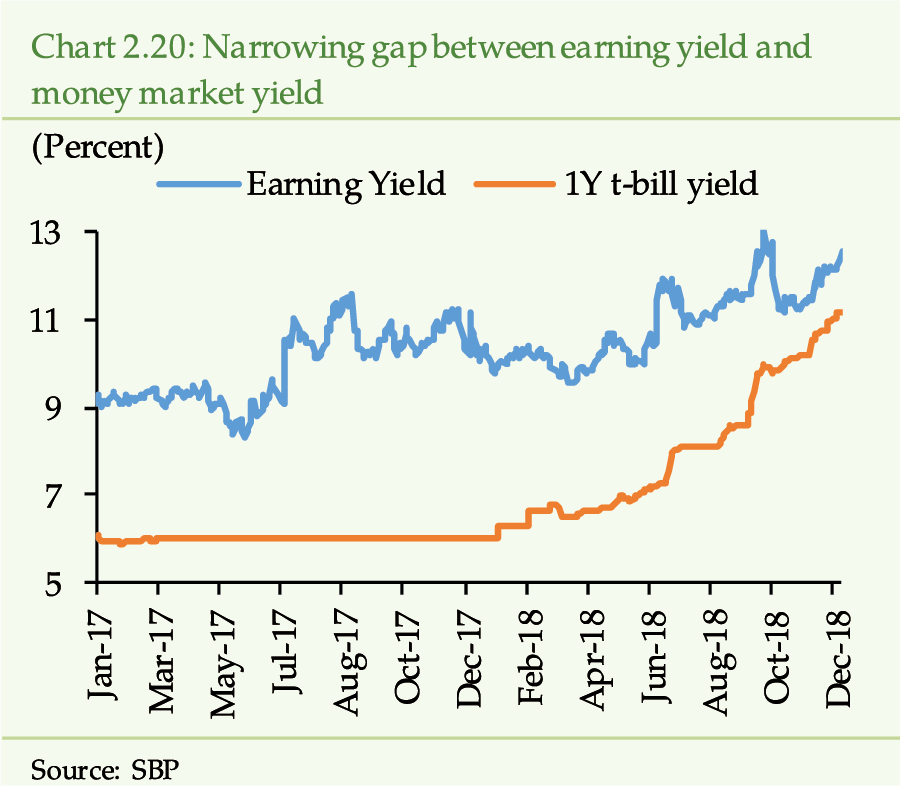
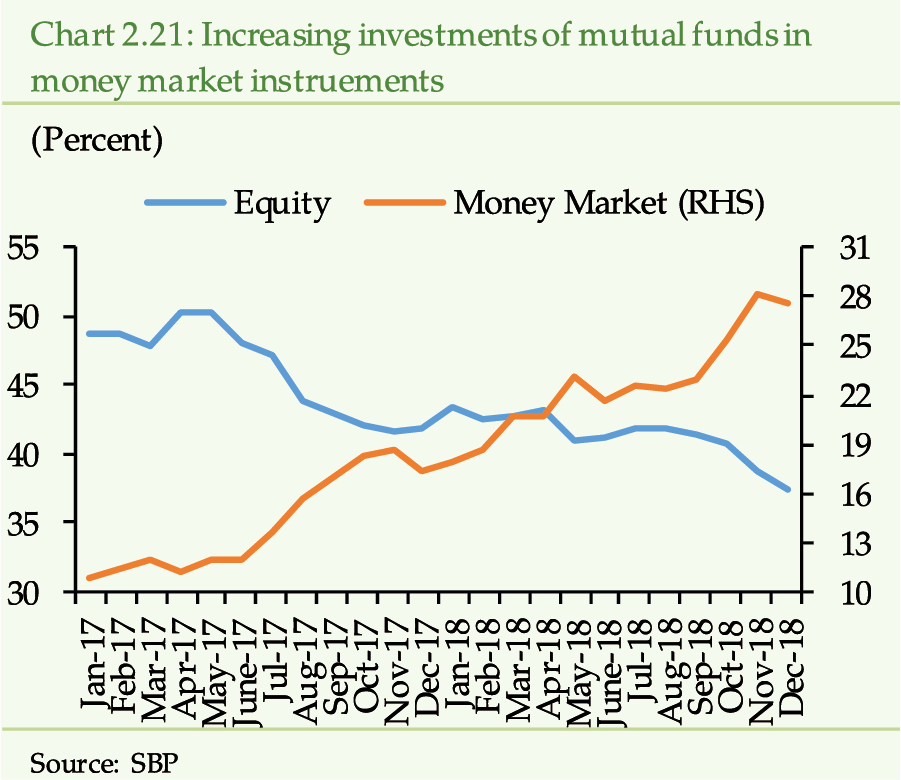
Increased risk aversion is also reflected in the
persistent net outflow of foreign portfolio investment (Chart 2.22).
[22]
Though the foreign investors has been net sellers
in the previous year as well, the bearish sentiment has been re-enforced
by the fading macroeconomic prospects.
[23]
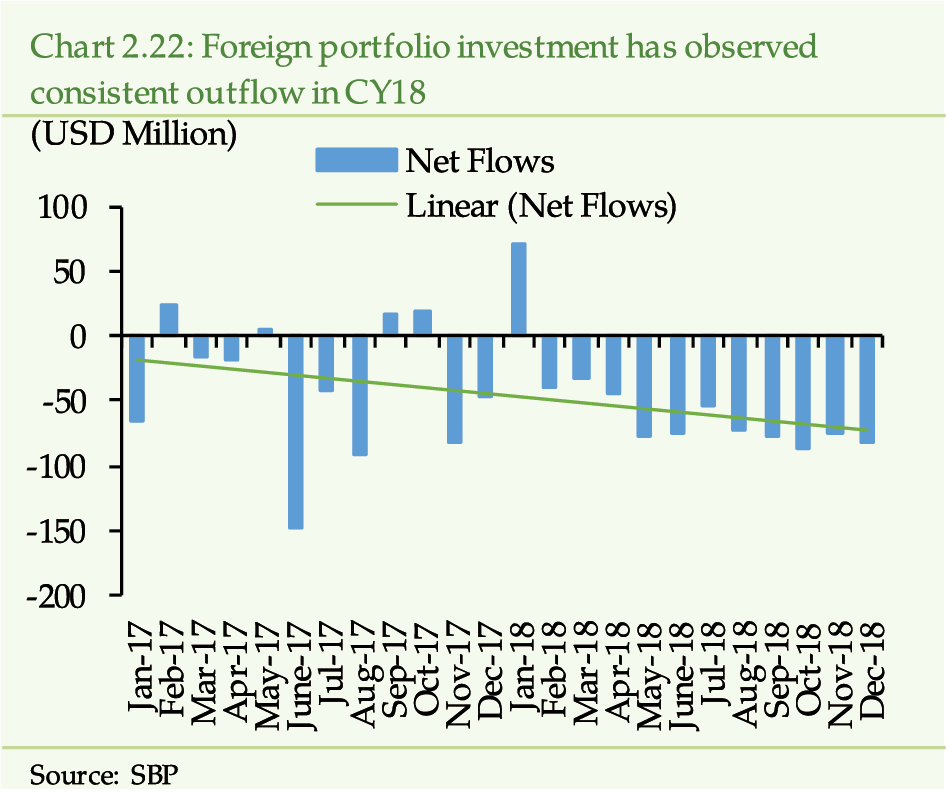
and rise in market volatility
The non-conducive market conditions have kept the volatility in the equity market at elevated level (Chart 2.17). Notably, the nervous withdrawal by the foreign investors from the market could have resulted in higher volatility, had it not been mitigated by active participation of domestic institutional investors such as Insurance (Chart 2.23).
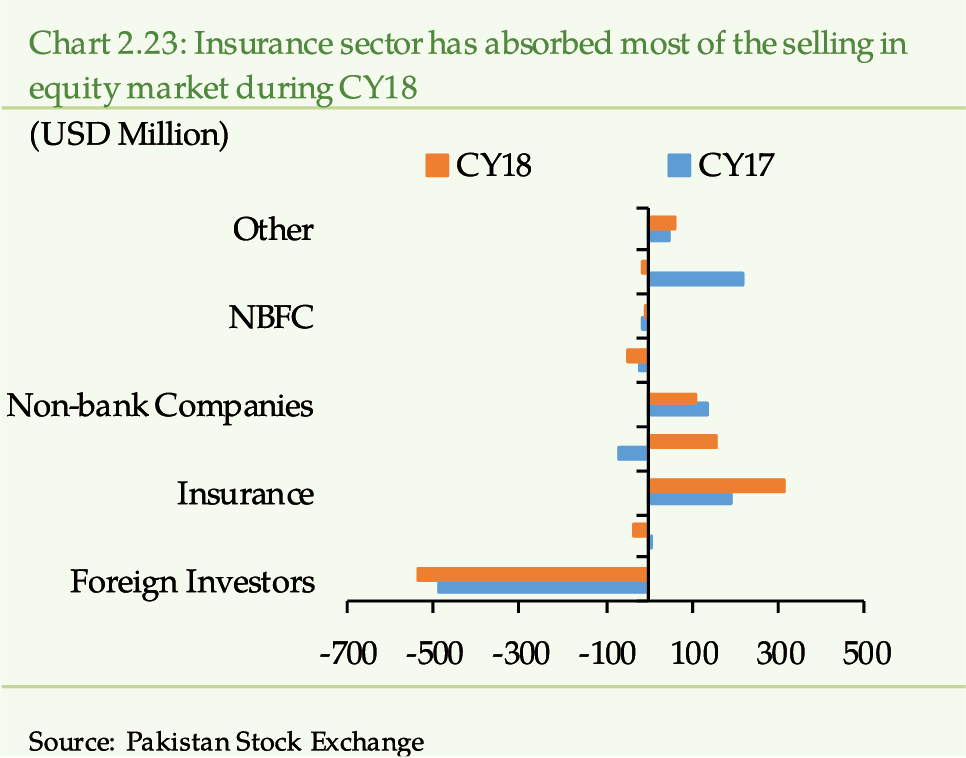
Though, the downside risks to equity market returns remain muted
Value at Risk [24] (VaR) analysis indicates thatdespite the prevailing stress in the equity marketdownside risks to the market returns have remained contained during CY18 (Chart 2.24). The actual returns of KSE-100 index have breached the VaR measure with lower frequency (17 times in CY18 vs. 20 times in CY17). Moreover, unlike CY17, the returns have not dipped below the stressed VaR [25] during CY18.
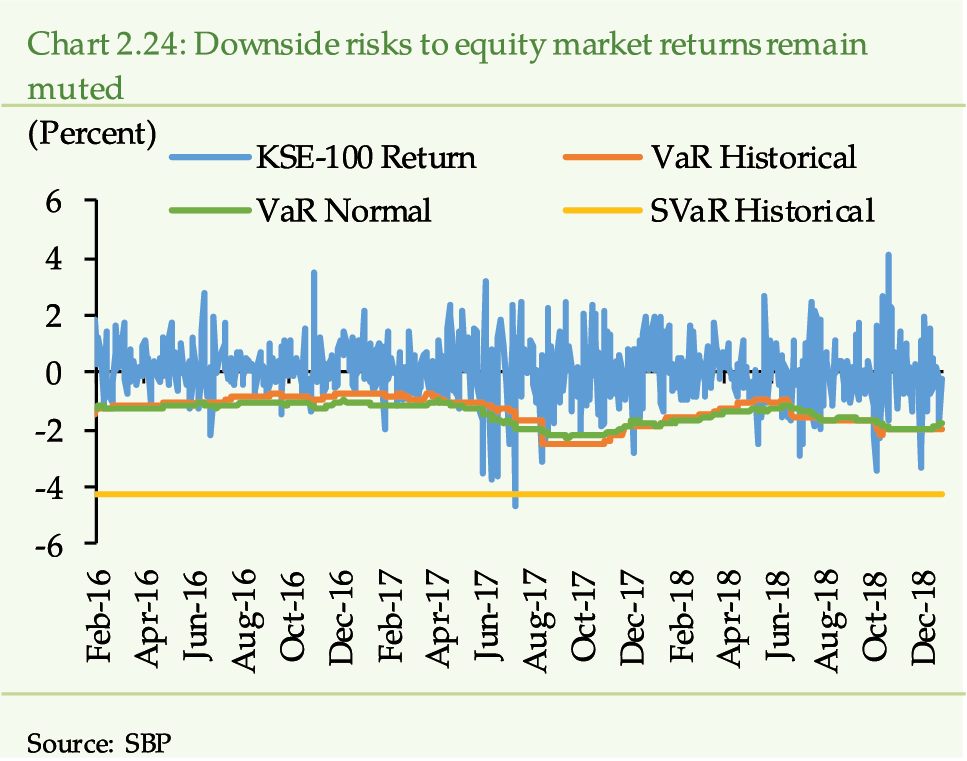
The
equity market returns are in-sync with MSCI Emerging Market Index
The synchronized behavior of KSE-100 index with
MSCI EM index during CY18 suggests that the idiosyncratic vulnerabilities
experienced by the EMDEs as a group have been aggravated by the external
environment.
[26]
Moreover, the correlation between domestic equity
market and S&P 500 index has not only weakened over-time but it has
also turned negative in H2CY18 (Chart 2.25). This recent decoupling
suggests the growing chasm between the business cycles of the US and domestic
economy, the flight to safety motive of global investors, and weakening
of spillover effect through trade channel in view of the protectionist stance
in the US.
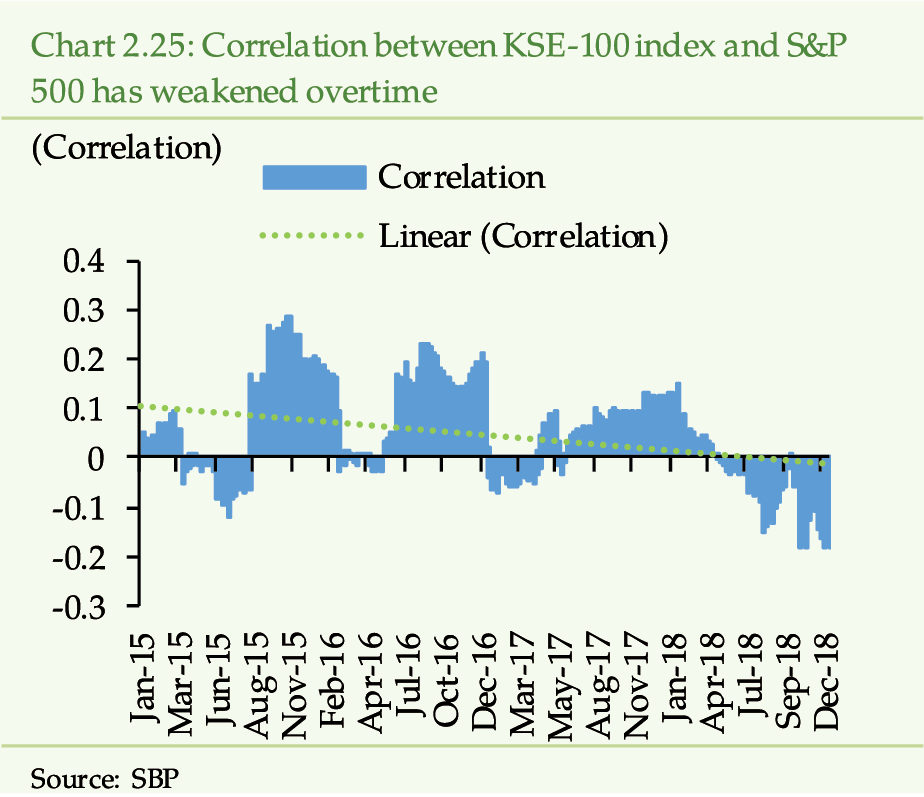
Going
forward, the stability in financial markets hinges on several factors
Domestic financial marketsparticularly forex and
equity marketsin CY18 have remained volatile primarily due to external
account pressures, higher fiscal deficit, rising inflationary pressures,
and elevated uncertainty among market participants. In addition, the dearth
of US dollar liquidity has been important aspect of financial markets behavior
and connectivity during CY18 (see Box 3).
Going forward, improved stability in the financial
marketsparticularly forex and equity marketslargely depends on (i) how
effectively the dearth of forex market liquidity is addressed; (ii) the
realization of anticipated outcomes of corrective policy measures; (iii)
the direction of investors sentiments; and (iv) the successful implementation
of the IMF program.
Box 3: US Dollar Liquidity
Remains an Important Aspect of Inter-Connectedness and Financial Markets
Behavior during CY18
In CY18, US dollar liquidity
has remained one of the important aspects of connectivity in domestic financial
markets. Forex market developments have affected equity market through lower
dollar adjusted returns
[27]
on foreign investment and rising inflation (exchange rate pass-through
impact). Lower dollar adjusted returns have resulted in net outflow of foreign
portfolio investment exerting pressure on equity market and exchange rate
(Chart A1).
[28]
With rising inflation, SBP increased its policy rate, which in
turn translated into higher lending rates thereby increasing cost of borrowing
for the corporate sector. Resultantly, increased financial expenses undermined corporate earnings
and added to selling pressure in the equity market.
Also, rising yield in money
market instruments (treasury bills) concomitant with falling stocks prices
have triggered investment flows towards money market funds from the equity
market.
The link between forex
and money market is also reflected through forward premium. Rising interest
rates in the domestic market relative to the interest rates in foreign
marketsshould make up higher forward premium in forex swap transactions.
However, despite notably higher interest rate spread, forward premium during
H2CY18 has remained squeezed due to the dearth of dollar liquidity coupled
with expectations of PKR depreciation in the domestic market.
To conclude, US dollar
liquidity has played vital role in explaining the behavior and inter-connectedness
of financial markets during CY18.
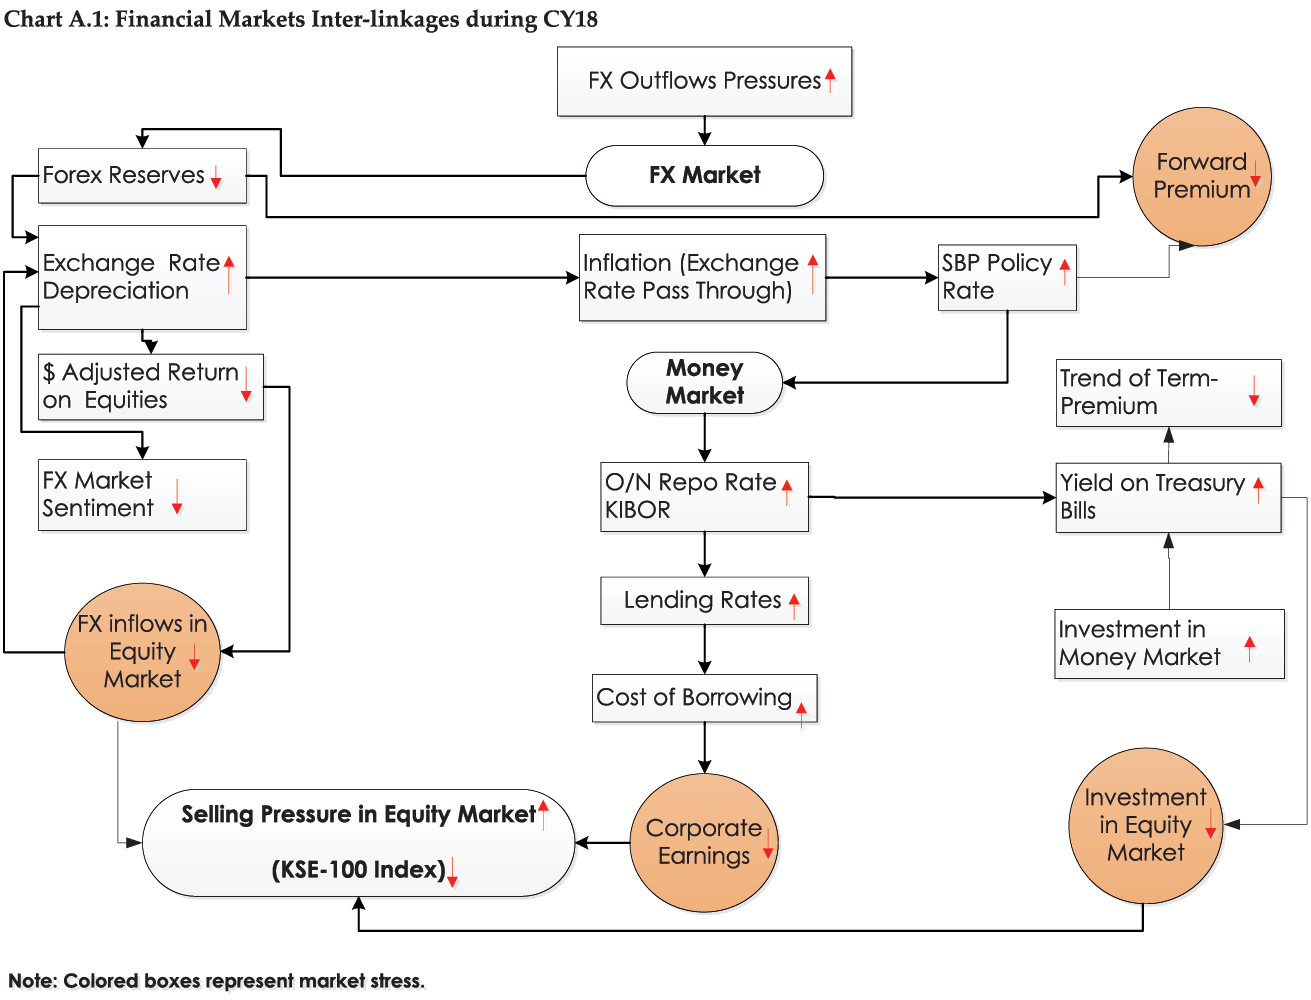
[1]
(a)Reserve Bank of Australia (2018). Financial Stability Review.
October.
(b) Low risk free ratesin the backdrop of accommodative
monetary policyare driving up asset prices, as these rates are central
to many asset prices.
[2]
(a)Standard valuation metrics suggest that equity prices in the
USA are hovering at levels significantly above its historical norm.
(b) According to IMF (Global Financial Stability
Report-2018),total nonfinancial sector debt in jurisdictions with systemically
important financial sectors has grown from $113 trillion (more than 200
percent of their combined GDP) in 2008 to $167 trillion (close to 250 percent
of their combined GDP).
[3]
Stress represents rising bond spread, declining equity prices
and notable currency depreciation.
[4]
IMF. (2018). Global Financial Stability Report. Washington, October.
[5]
Financial Market Stress Index is a composite indicator that measures
the level of stress emerging from foreign exchange, money, and equity markets.
For technical details see Appendix A.
[6]
In CY18, trade deficit stands at USD 33 billion against USD 31
billion in CY17.
[7]
On average, exchange rate has depreciated by 15.48 percent during
CY18.
[8]
Forward premium on currency swap is based on interest
rate differential prevailing between two currencies in a pair. Higher the
differential implies higher forward premium. However, the settlement of
interest rate spread at par requires easy liquidity conditions of both currencies
involved. For instance, if US dollar liquidity is tight in the domestic
market then in such conditions, the US dollar lender would pay less premium
than what interest rate differential suggest against PKR borrowing.
[9]
Lower spread in H1CY18compared to H1CY17has been on account
of consistent increase in LIBOR.
[10]
SBP net reserves, on average, stood at USD 8 billion
in H2CY18 against USD at 14 billion in H2CY17.
[11]
In CY18, IRS deals amount to PKR 19 billiondown from
PKR 23 billion in CY17.
[12]
In CSS deals, counterparties exchange two different currencies
at spot rate at the inception of the contract. Both parties receive interest
rates on lending currency and pay on borrowed currency. The currencies are
exchanges at the end of the contract with pre-determined exchange rate.
[13]
In CY18, CSS deals amount to PKR 22 billionup from
11 billion in CY17.
[14]
The term-premium has been proxied by the spread between
long-term (3Y PIBs) and short-term (3M T-bills) yield.
[15]
CY17 statistics show that out of the total 26 auctions held for
6M treasury bills, bankswith one rejectionparticipated in 25 auctions.
However, in CY18, participation is down to 13 auctions with 6 rejections
due to higher bidding.
[16]
Banks participated in 20 auctions against 12M treasury
bills during CY17 while 4 were rejected. In CY18, banks have participated
just in one auction which has been rejected.
[17]
In CY18, most of the bids have been rejected in PIBs.
[18]
Re-pricing of the debt with higher frequency could lead to higher
cost of debt servicing especially in rising interest rate scenario.
[19]
Earnings before interest and taxes (EBIT). It represents 303
firms listed on Pakistan Stock Exchange
[20]
Financial expenses of 303 listed firms are higher by 19.35 percent
in CY18 as compared to CY17.
[21]
Earnings yield refer to the earnings per share for the most recent
12-month period divided by the current market price per share.
[22]
In CY18, cumulative net foreign investment outflow
from equities stands at USD 647 million against USD 447 million in CY17.
[23]
Pakistans sovereign risk ratings by Fitch has been revised downward
to B in Jan-18 and further to B Negative in Dec-18.
[24]
VaR represents the probable amount (or percentage) of downside
risk of investment at any given point in time. Here, to assess the riskiness
of KSE returns, 100 days rolling Historical and Normal VaR along with stressed
VaR (SVaR), at 95 percent confidence level, have been computed.
[25]
Stressed VaR refers to minimum 100-days rolling value during
the entire sample period (January 2001-December 2018).
[26]
The correlation coefficient turns out 0.78 between
MSCI EM and KSE-100 index during CY18. Moreover, the returns (on average)
of MSCI EM (-.06 percent) and KSE-100 index (-.05 percent) have been almost
the same.
[27]
Exchange rate depreciation results into lower dollar adjusted
returns as foreign investment return on equity is measured in PKR. Therefore,
returns deliver back less dollars in case of domestic currency depreciation.
[28]
During CY18, except the month of January, equity market has observed
consistent net foreign investment outflow.
3.1
Performance and Risk Analysis of the Banking Sector
The banking sector has remained resilient during
2018 despite challenging macrofinancial conditions. The solvency has further
improved, the fund-based liquidity has remained at a comfortable level and
the interconnectedness within the banking sector has stayed unchanged. The
financing growth has surged and the Non-Performing Loan ratios has touched
its lowest level since CY08, though quantum of Non-Performing Loans has
increased. Deposits, despite some deceleration, have remained the mainstay
on the funding side. The pace of decline in profitability has receded and
the reliance on interest income has increased. Going forward, credit, market
and other emerging risks (such as AML/CFT and Cybersecurity) may pose significant
challenges for the banking sector, though. The banks may also encounter
funding constraints if the deceleration in deposit growth prolongs.
Banking
sector responds well to the tighter macrofinancial conditions
During CY18, the banking sector has weathered the
macrofinancial headwinds with limited impact on performance and soundness.
The asset growth of the banking sector has decelerated
mainly due to net-maturity of long-term government bonds. The liquidity
thus generated, in addition to support from growth in deposits, has not
only enabled banks to meet higher cost-push financing demand but also lowered
their borrowings (Chart 3.1.1). Encouragingly, advances disbursements
have been broad-based to multiple economic sectors leading to uptick in
advances to deposit ratio. The asset quality has observed a mixed trend
with Non-Performing Loans (NPLs) ratio continuing to decline, albeit, with
increase in quantum of NPLs.
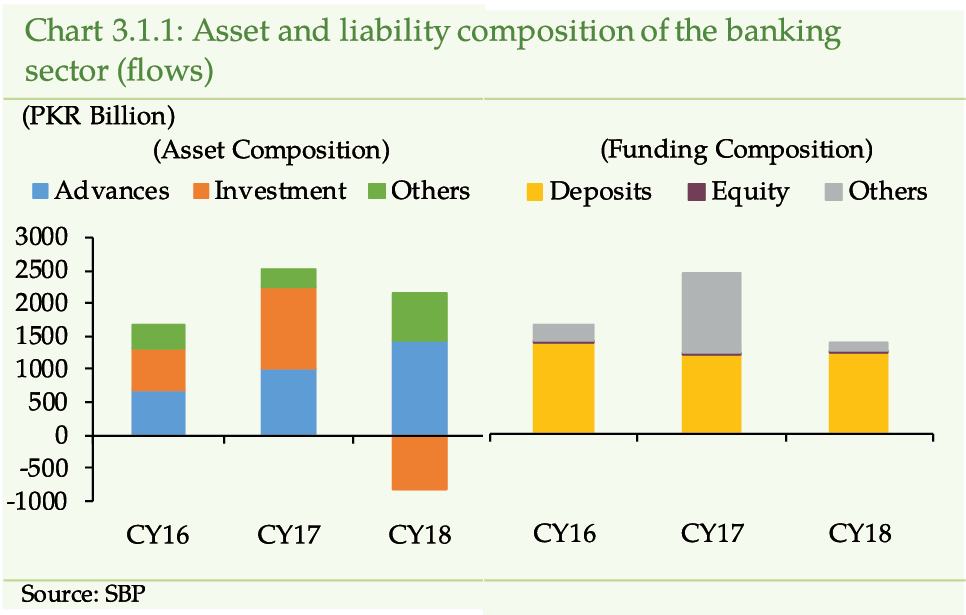
The profitability of the banking sector has continued
to moderate during the year. However, the pace of decline has receded due
to rising volume of interest income coming from healthy growth in advances
and increase in interest rates.
The level of interconnectedness remains similar
to last year with decline in volume of unsecured borrowing and lending.
The solvency has further strengthened with CAR inching up to 16.2 percent,
which is well above both the global and local minimum benchmarks. However,
few small banks are facing challenges on liquidity and solvency fronts.
The consolidated picture of key risk dimensions of the banking sector has improved which is evident from the Banking Sector Stability Map (BSSM) and Banking Sector Vulnerability Index (BSVI) (Chart 3.1.2 and 3.1.3).
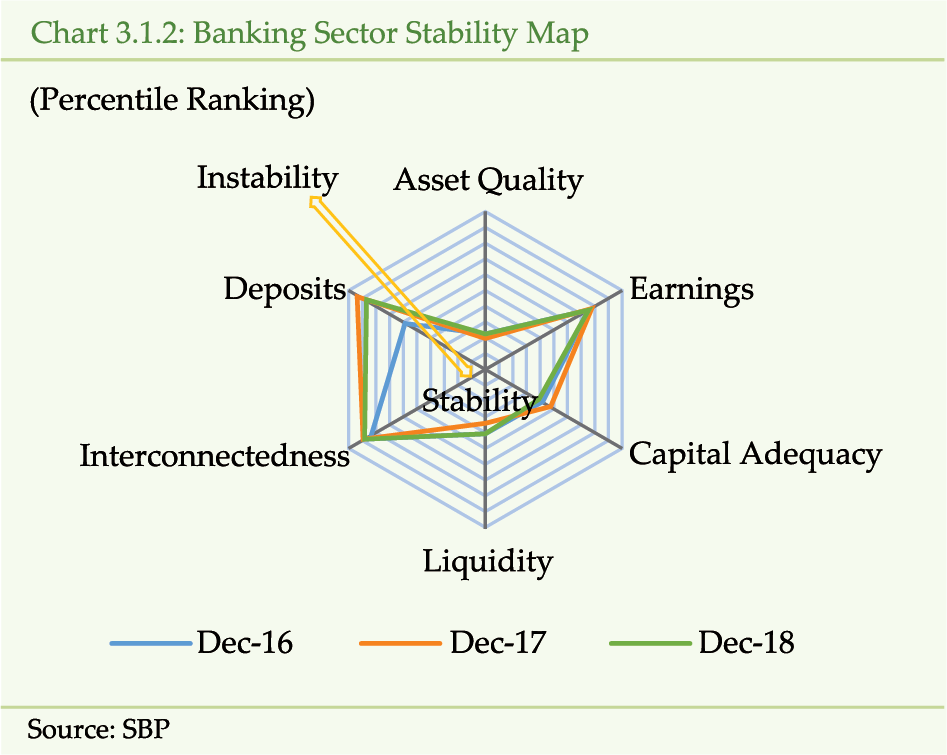
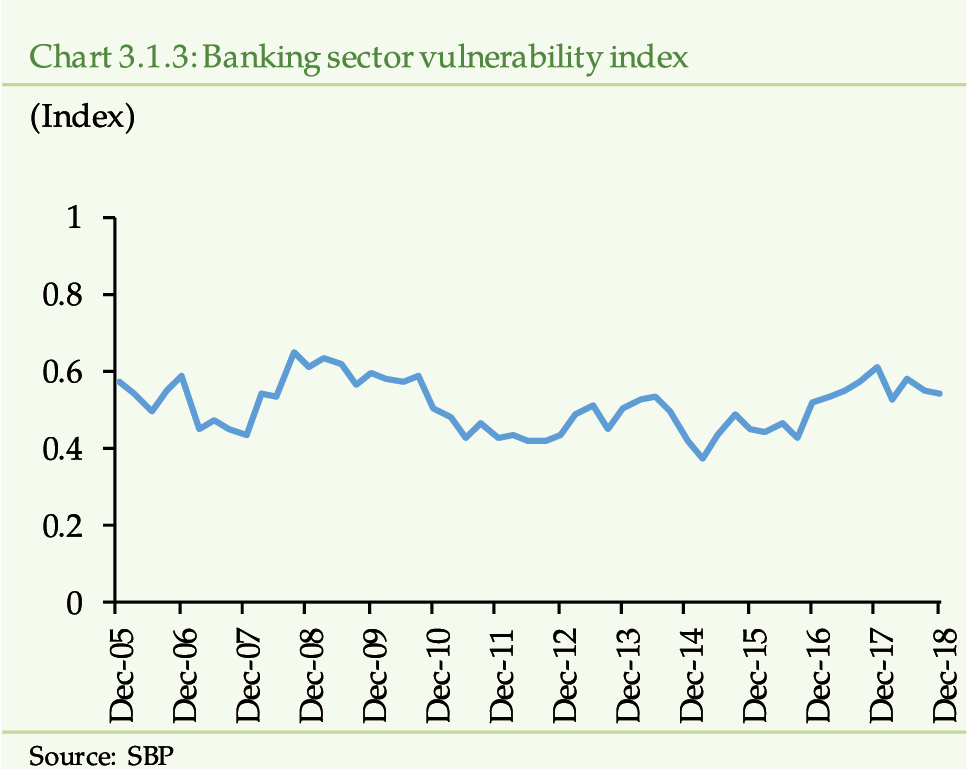
1. Asset Quality
Credit risk of the banking sector in Pakistan mostly
emerges from loans, as the banks have limited exposure in private sector
debt instruments (e.g. Term Finance Certificates, Sukuk, debentures etc.).
In addition, the significant holding of domestic government securities carries
only market risk, as it attracts zero credit risk weight under Basel III
capital adequacy rules.
The
NPLs of banking sector advances rises
NPLs, which had been hovering around PKR 600 billion
during CY11-17, have escalated by 14.7 percent to reach PKR 680 billion
by end of CY18, both, due to addition of fresh NPLs and lower cash recoveries.
Most of the fresh domestic NPLs have emerged in
sugar, agriculture, and production and transmission of energy sectors along
with individuals. The low market price of sugar and ongoing legal proceedings
against one of the corporate groups, with large exposure in sugar, has resulted
in classification of loans in this sector. Also, the delayed purchase and
crushing of sugarcane by the sugar mills restrained farmers from fulfilling
their financing obligations to banks on time. The rise in agriculture sector
NPLs results from low yields owing to water shortage and drought conditions,
late procurement of wheat by public procurement agencies, default in government
declared calamity affected area, and rise in input prices (such as seed,
fertilizers, pesticides, electricity and POL) due to PKR depreciation.
Besides domestic defaults, foreign operations of
banking sector have contributed 39.02 percent in the flow of NPLs during
CY18. This mostly relates to few banks exposure in GCC countries. These
bad loans, mostly, pertain to electronics appliances and automobiles sectors
as well as individuals. In addition, PKR amount of foreign operations NPLs
has, partially, escalated due to depreciation of domestic currency.
but,
the advances growth accelerates
The growth momentum in advances has accelerated
in CY18. The gross advances have risen by 21.27 percent in CY18 compared
to 16.90 percent in CY17. The key thrust has come from domestic advances
(both private and public). Resultantly, advances to deposit ratio has inched
up to 55.81 percent; the highest level since Q4CY11.
The domestic private sector has observed an active
buildup of financing flows of 20.0 percent across the corporates, SMEs,
consumers and commodity operations. There has been strong growth in working
capital financing followed by trade finance (Chart 3.1.4). Sector-wise,
the major private borrowing pertains to textile, food and beverages, cement,
production and transmission of energy, chemicals, real estate sectors etc.
The public sector advances, up by 28.47 percent,
has major contribution from fixed investment loans due to settlement of
circular debt through state owned Power Holding Private Limited (PHPL),
project expansion and Balancing, Modernization, and Replacement (BMR) (Chart 3.1.4).
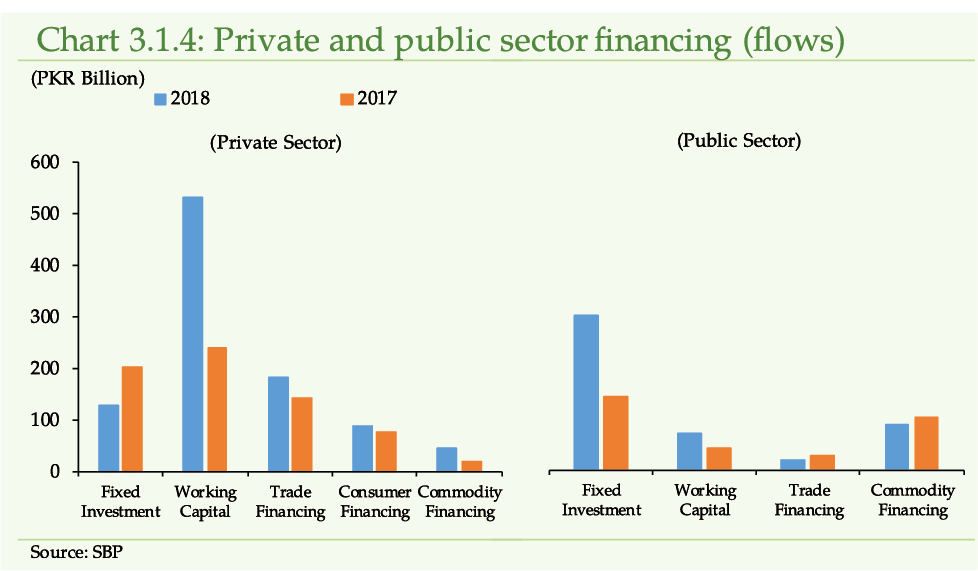
However, rise in financing urges caution
The following factors suggest that advances growth
may be viewed with caution:
(a) The rise in working capital flows is mainly due to higher input/raw material prices owing to PKR depreciation (Chart 3.1.5). This is evident from the slow real economic activity in the manufacturing sector. The large-scale manufacturing (LSM) index has observed a growth of only 1.40 percent in CY18.
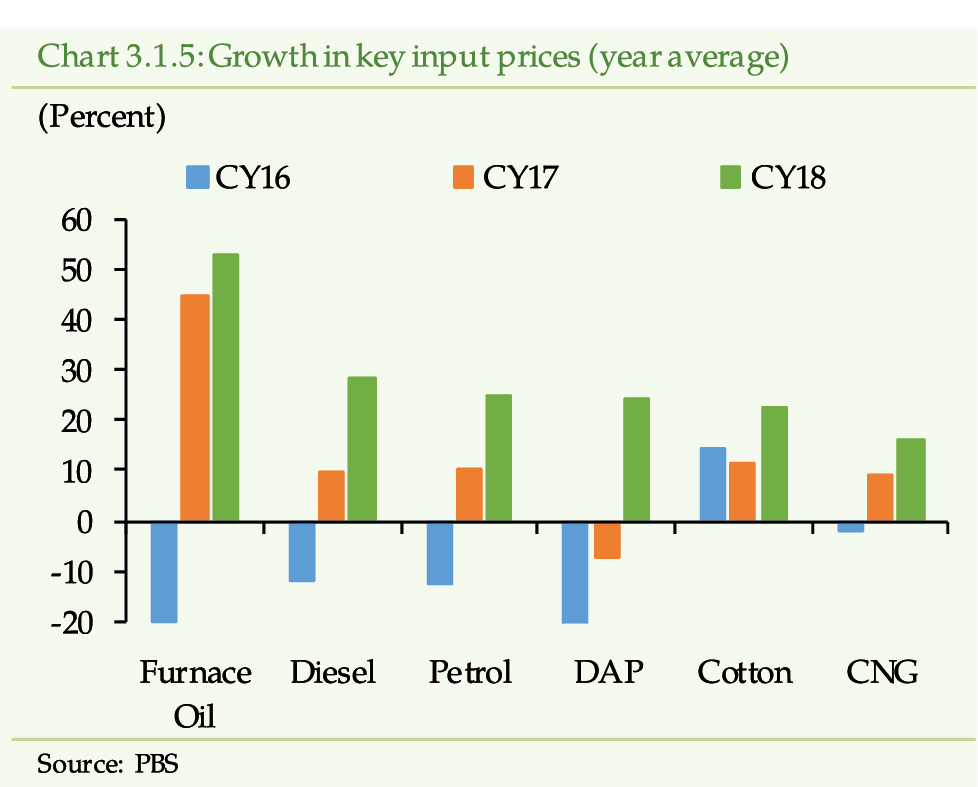
(b)
After growing persistently during the last few years, the private sector
fixed investment financing growth has decelerated to 8.25 percent, in CY18
compareto 14.97 percent in CY17. A broad based deceleration has occurred
in various sectors including textile, construction, transport, storage and
communication, chemicals and chemical products. This contraction in demand
is likely due to (i) tightening of macro-financial conditions (ii) completion
of ancillary projects (mostly infrastructure and power) related to CPEC
and (iii) downbeat investor sentiments.
[1]
(c) The liquidity glut has induced banks to not
only offer loans at lower margins but increase the average loan size also.
[2]
,
[3]
Due to high competition in extending loans, banks have offered
financing even at KIBOR, which means that banks have assumed credit risk
on their corporate clients at par with their interbank exposures (underpricing
of risk).
[4]
Moreover, though the number of private business loan applications
have reduced from 1.33 million in CY17 to 0.76 million in CY18, the average
loan size has more than doubled (from PKR 3,389 in CY17 to PKR 6,887 in
CY18).
(d)
The reviewed year has witnessed higher financing demand in production and
transmission of energy sector. However, a significant portion of public
sector financing has been utilized for the settlement of circular debt and
hydel payments by federal government to the provincial government using
one of the PSEs as a vehicle for routing funds.
(e)
Consumer financing has increased by 19.74 percent, primarily, due to pick-up
in personal loans category. The growth in auto loan, a key contributor in
consumer financing since the last few years, has decelerated due to bar
placed on non-filers from purchasing/ registering vehicles.
As
the financing growth outpaces NPLs buildup, the infection ratio slides
Due to higher proportionate growth in advances than
NPLs, the overall NPLs ratio has reduced to 7.97 percent by end CY18 compared
to 8.43 percent in CY17. The fall is obvious in most of the key sectors,
except sugar (Figure 3.1.6). Textile sector, which is the largest
borrower of the banking sector, has witnessed a dip in the infection ratio
as well as in absolute value of NPLs.
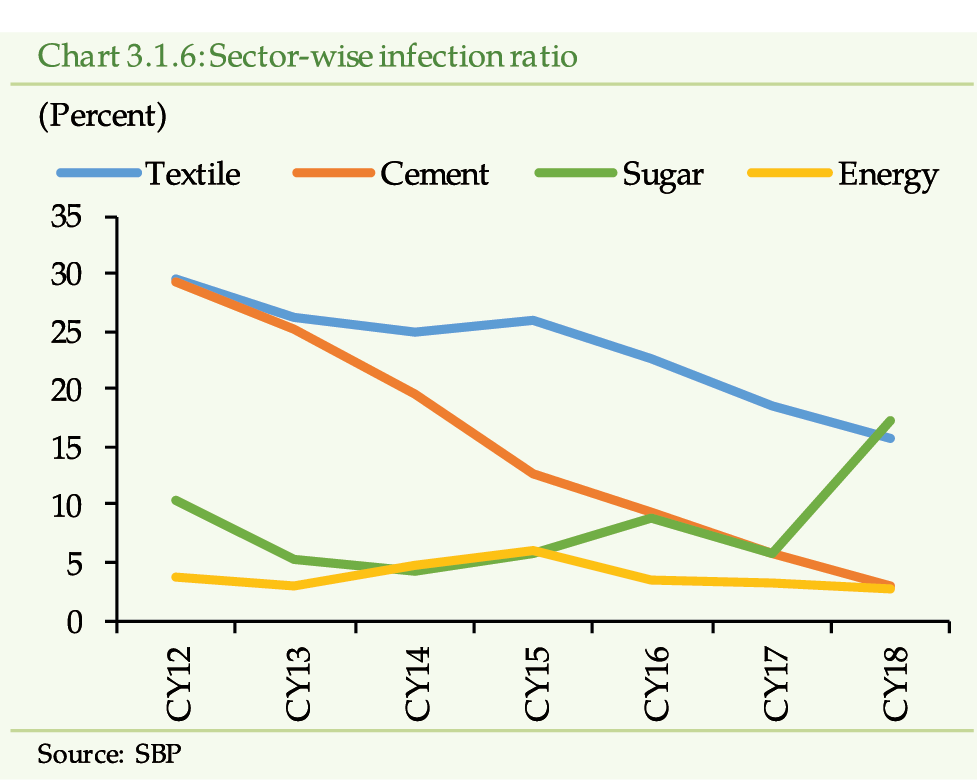
though
net credit risk rises for specialized and local private banks
The provision coverage ratio has come down from
87.24 percent in CY17 to 83.80 percent in CY18. This decline has largely
resulted from increase in NPLs in Agriculture and sugar sector especially
in case of Specialized and local private banks (Table 3.1.1). Consequently,
the net-NPLs to net-loans ratio has risen to 1.38 percent as of end CY18
compared to 1.16 percent as of end CY17. Though the coverage still seems
adequate, 20.40 percent of outstanding NPLs are still held in Other Asset
Especially Mentioned (OAEM), subordinate and doubtful categories. Any further
downgrading, going forward, may lead banks to bear additional provisioning
expense (Figure 3.1.7).
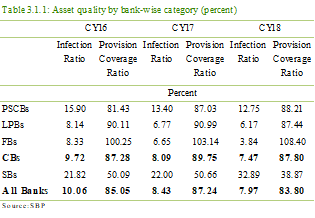
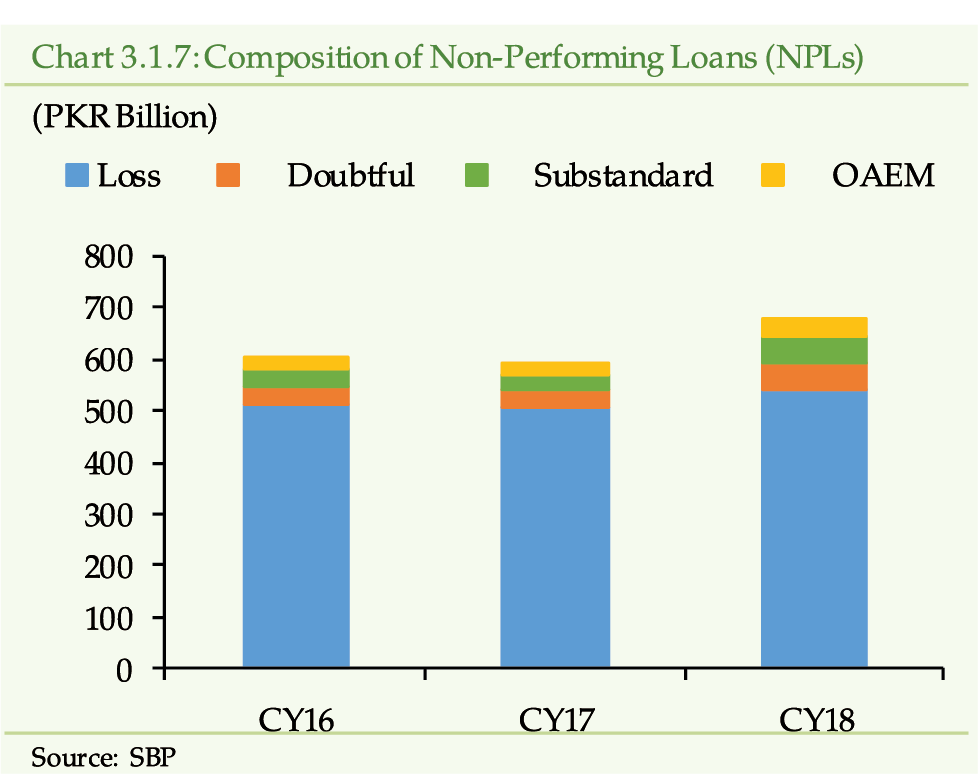
While
some small sized banks have become more vulnerable to credit risk
During CY18, small sized banks (asset share: 8.04
percent) and very small size banks (asset share: 1.68 percent) have become
more prone to credit risk with the rise in infection ratio as well as decline
in the provisioning coverage ratio (Table 3.1.2). These are the banks,
which contain major share in the flows of NPLs during the reviewed year.
On the other hand, large and medium size banks have improved both in terms
of infection ratio as well as provisioning coverage.
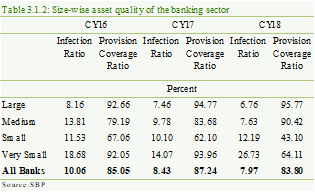
and
the lag impact of monetary tightening may impact asset quality
Though banks fresh loans are disbursed at a higher
rate in response to monetary tightening, there still exists a significant
portion of outstanding loans, which may be repriced with some lag due to
contractual bindings. The fact that major rise in policy rate has occurred
towards the end of CY18 and beyond, the borrowers may face further hike
in interest expense later on. This coupled with the lower corporate profitability
may deteriorate the repayment capacity of borrowers and increase NPLs. Generally,
a lag of four to six quarters exists between the rise in interest rates
and the subsequent buildup of NPLs.
[5]
Pro-cyclical
systemic risk remains subdued, despite continuous growth in advances
The growth momentum in advances since last few years
and recent economic slowdown warrants an assessment of pro-cyclical systemic
risk in the banking sector of Pakistan.
[6]
,
[7]
The Advances to GDP ratio against its long-term trend, one of
the commonly used indicators to assess pro-cyclical systemic risk, reveals
that the gap has turned positive and is on the rise (Chart 3.1.8).
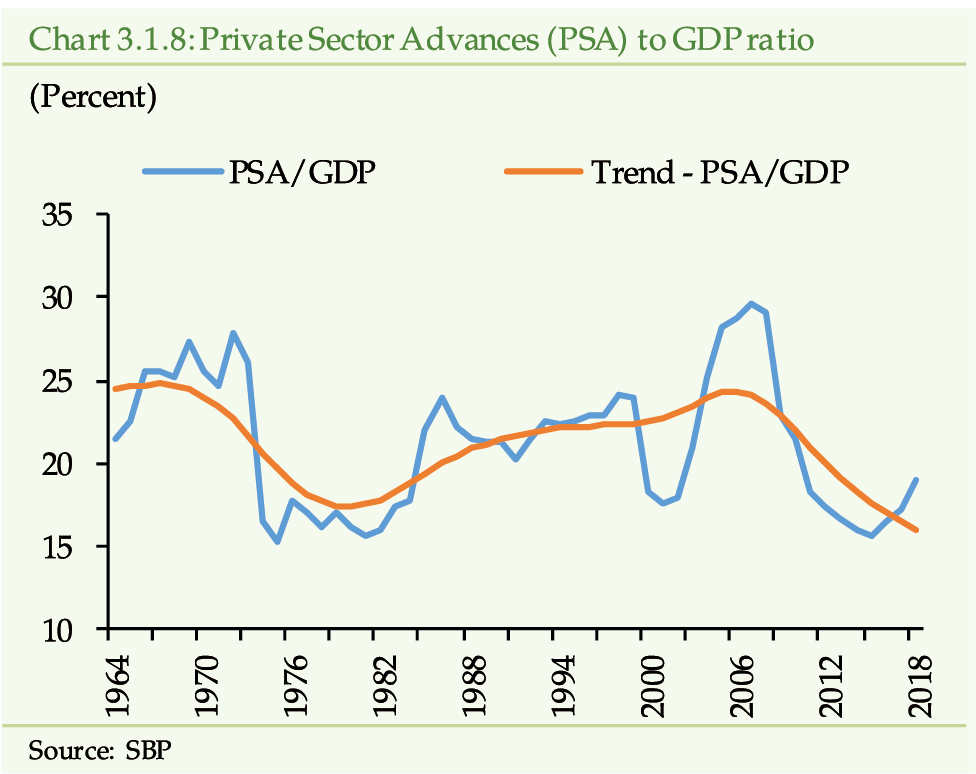
However, credit-overheating possibilities are remote
because:
(a)
The magnitude of advances to GDP ratio in Pakistan is, in itself, not that
high compared to even the peer counterparts (Chart 3.1.9). The ratio
in Pakistan has been hovering around 15-20 percent historically and peaked
at 29.66 percent in 2007. It currently stands at 17.24 percent only.
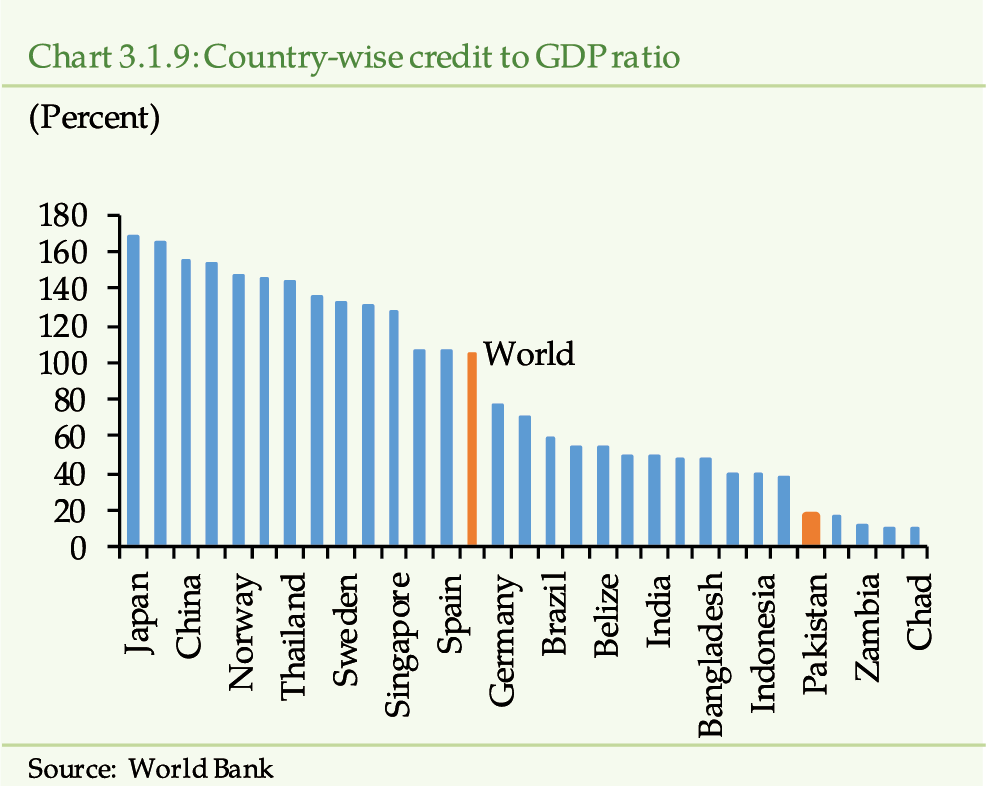
(b)
The dominant channel of systemic risk where real estate collateral prices
and credit expansion reinforces each other (e.g. Global Financial Crisis
2006-7) is weaker in Pakistan. The mortgage financing stands only at 0.25
percent of GDP and has a meager share of 1.07 percent in domestic lending
portfolio. Further, residential real estate collateral secures only 11.35
percent of the banking exposure (Chart 3.1.10).
[8]
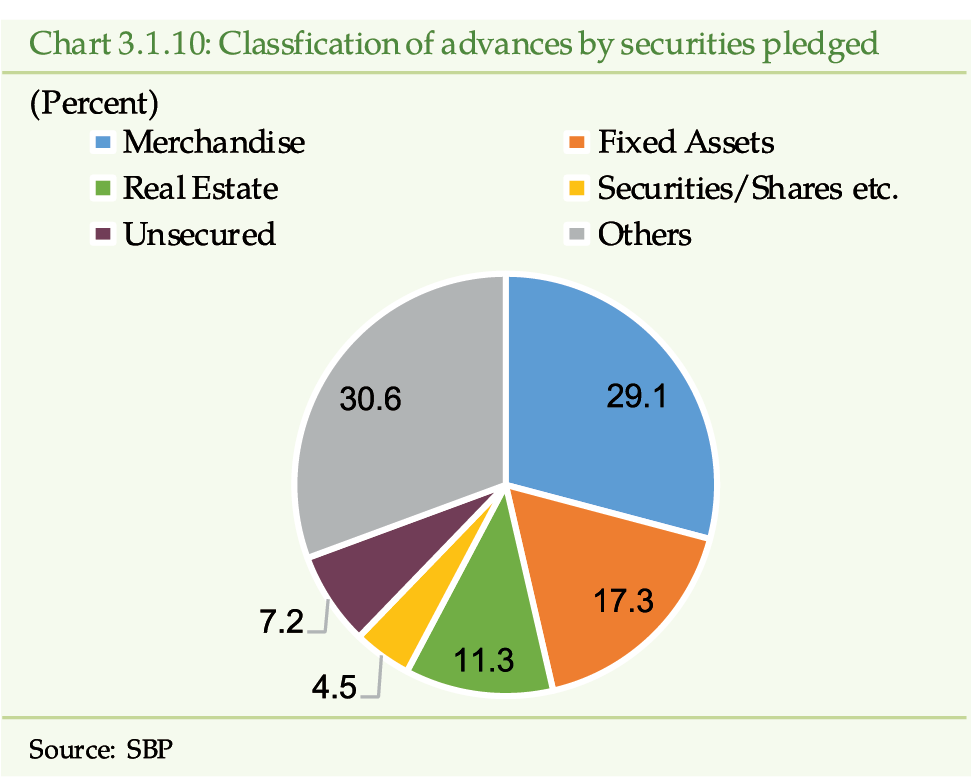
(c)
The limited cross-border exposure (both lending and borrowing) prevent the
domestic financial system from external spillover effects of abrupt capital
flows. .
(d)
The regulatory structure is quite extensive. SBP, in its regulatory domain,
has implemented the international best practices for enhancing the soundness
of the banking sector, in particular, and financial system, in general
[9]
. Moreover, SBP as part of its strategic goal Strengthening of
the Financial Stability Regime is working on putting in place an effective
Macro Prudential Policy Framework. (See Box 1.1 on SBP initiatives to
strengthen financial stability).
2. Deposits
The
structural risk also remains muted as deposits continue to be the mainstay
of funds leading
The steady growth in deposits is pivotal for the
banks as it is the major source of funding. Deposits constitute 77.99 percent
of total liabilities and 72.42 percent of total assets, as of end CY18.
The deposits have contributed 92.68 percent in the asset expansion during
CY18.
During CY18, deposits have risen by 9.55 percent
(Y-o-Y) versus 10.29 percent in CY17; the lowest since CY08 (Chart 3.1.11).
This slowdown may be attributed to a mix of factors including (a) cost
cutting strategy of some banks to limit the growth of domestic remunerative
deposits, (b) scaling back of operations by few banks in overseas market,
(c) probable dampening effect of withholding tax on banking transactions,
(d) depositors concern regarding enhanced KYC requirements to contain AML/CFT
risks, and (e) additional liquidity available as a result of net-maturity
of investment.
In terms of category, deceleration in saving and
fixed deposits have overshadowed the rise in current deposits (Chart
3.1.11). The saving deposits have become costly due to Minimum Saving
Rate (MSR) policy in vogue.
[10]
Moreover, the fixed deposits could not attract the attention
of banks due to maturity re-profiling of their assets, both, in investments
(from PIBs to MTBs) and advances (from fixed term loans to short-term working
capital financing).
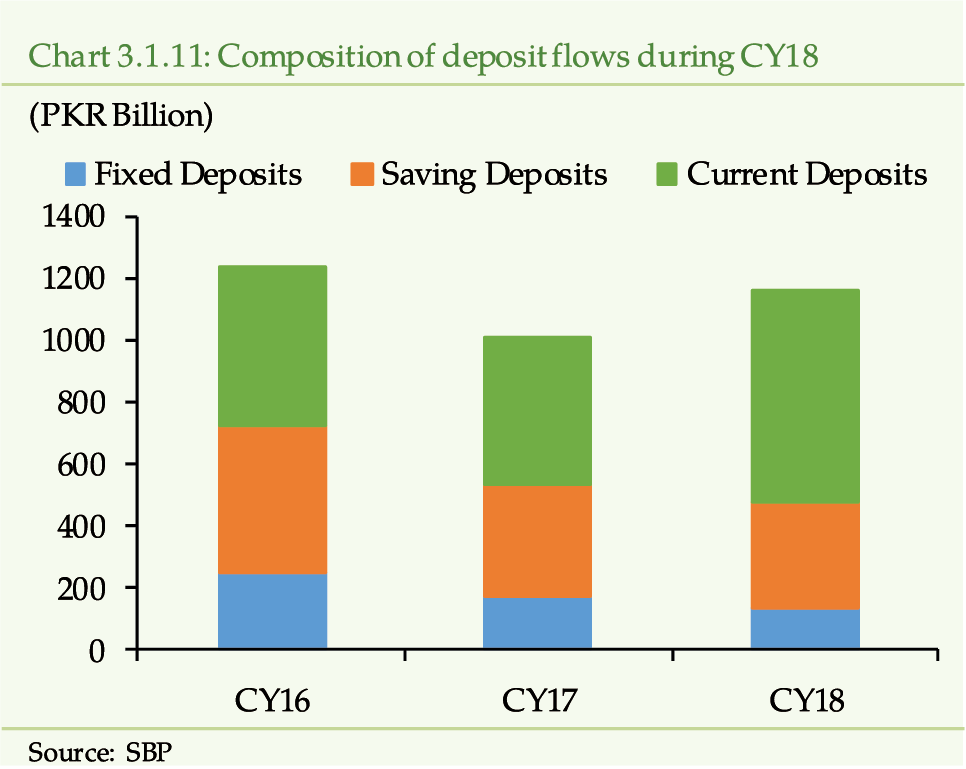
The size-wise distribution of deposits is also important
from the stability perspective. Generally, retail (small) deposits are more
stable and have longer retention periods than the large size institutional
deposits. Encouragingly, the reviewed year has witnessed growth in small
sized retail deposits up to PKR 1.0 million. On the other hand, growth in
deposits over PKR 10.0 million have been trending downwards (Chart 3.1.12).
[11]
This is due to declining flows of institutional deposits
(NBFIs, PSEs etc.) as well as private business deposits, particularly, the
manufacturing sector.
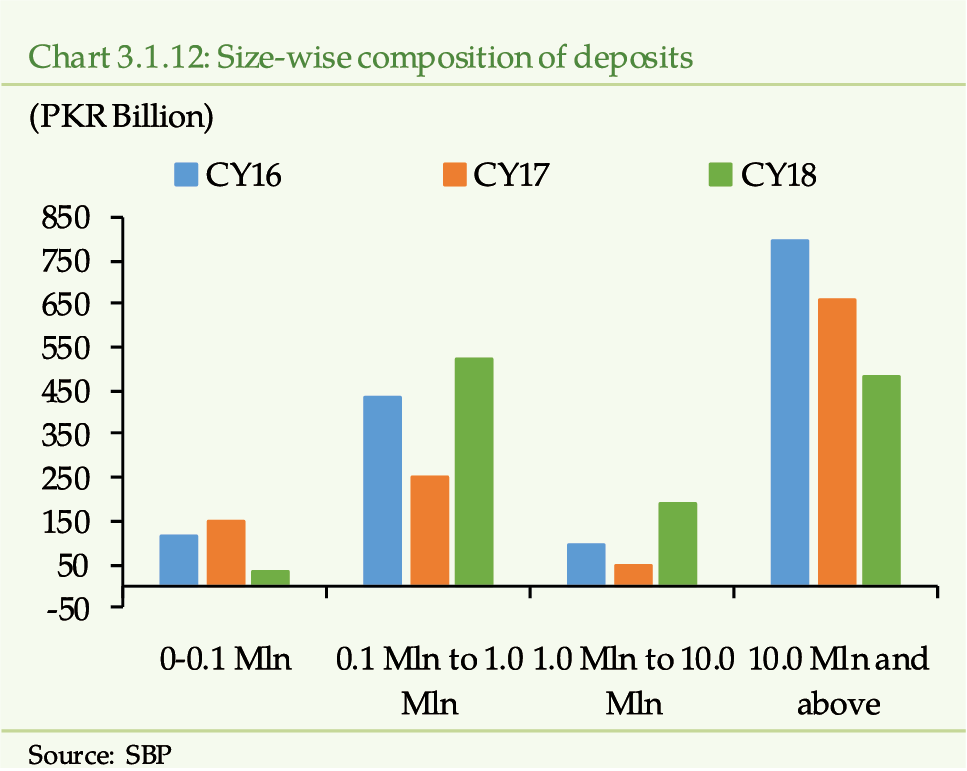
3. Interconnectedness
[12]
The level of overall integration in the banking
sector has almost stayed at the level as seen a year earlier. However, there
is a compositional shift. While volume of call (unsecured) lending and borrowings
during CY18 has reduced, the other interbank liability and assets have increased.
The lack of complexity in the financial sector,
within itself, provides an inbuilt stabilizer against the cross-sectional
systemic risk. The interbank exposure has low share in assets of the banking
sector, as deposits are the key source of funding. Further, the interbank
repo borrowings are, mostly, collateralized against highly liquid and credit
risk free government securities. In addition, absence of exotic instruments
and shallow capital market with limited debt instruments, keep the cross
institutional exposure and, resultantly, the likelihood of cross-sectional
systemic risk low.
The presence of large sized institutions may enhance
the likelihood and impact of systemic risk, though. Within the context of
cross-institutional exposure, the weighted average probability of defaults
(based on Merton model) of 5 largest banks has increased recently from 0.129
percent by end of CY17 to 0.188 percent by end of CY18 (Chart 3.1.13).
[13]
However, this narrowing distance to default seems to have emerged
due to higher volatility in the equity market during CY18, instead of weakness
in the fundamentals of these financial institutions as suggested by the
BSSM (see Chapter 2).
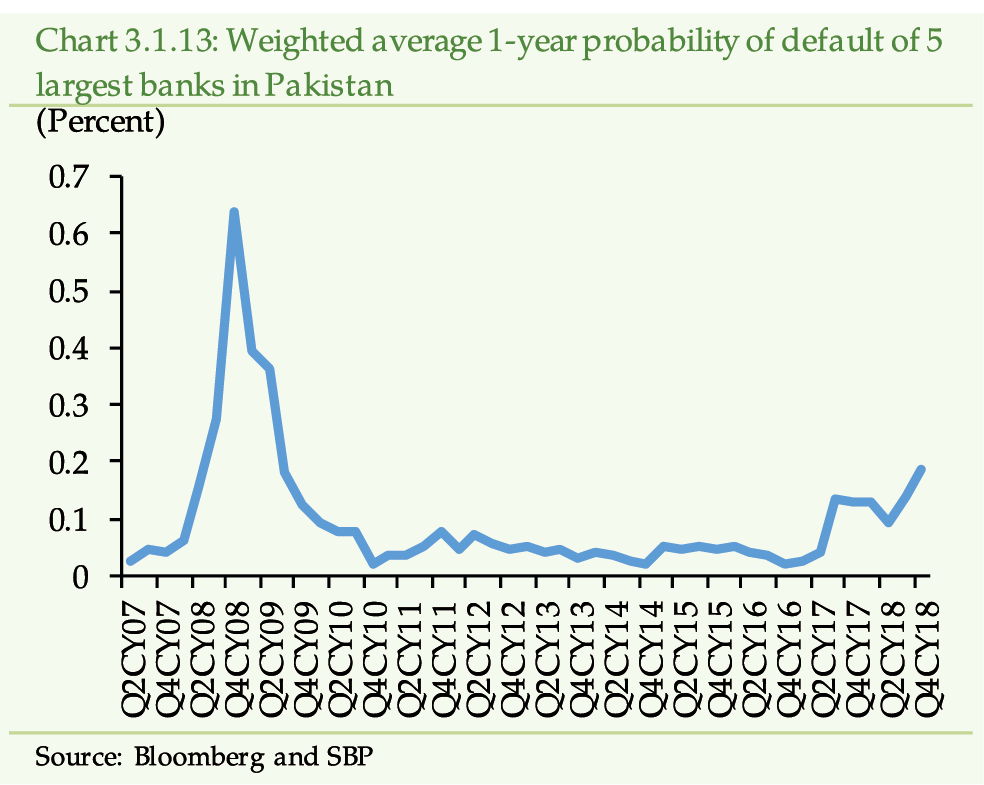
4. Liquidity
The fund-based liquidity of the banking sector is
mostly contributed by holding of government papers. During CY18, the liquidity
has slid down slightly due to net-maturity in banks holding of long-term
PIBs. However, the overall liquidity, with liquid assets maintained at 48.69
percent of total assets and 94.85 percent of short-term liabilities, is
still adequate to meet any contingent need of banks.
[14]
Similarly, eligible liquid assets against demand and time liabilities
stand at 51.82 percent; well above the required level of 24 percent for
CRR and SLR purpose (Chart 3.1.14). In terms of Basel III liquidity
standards, banks have maintained liquidity coverage ratio (LCR) at 182.72
percent and net stable funding ratio (NSFR) at 156.13 percent (both, well
above the minimum required ratios of 100 percent).
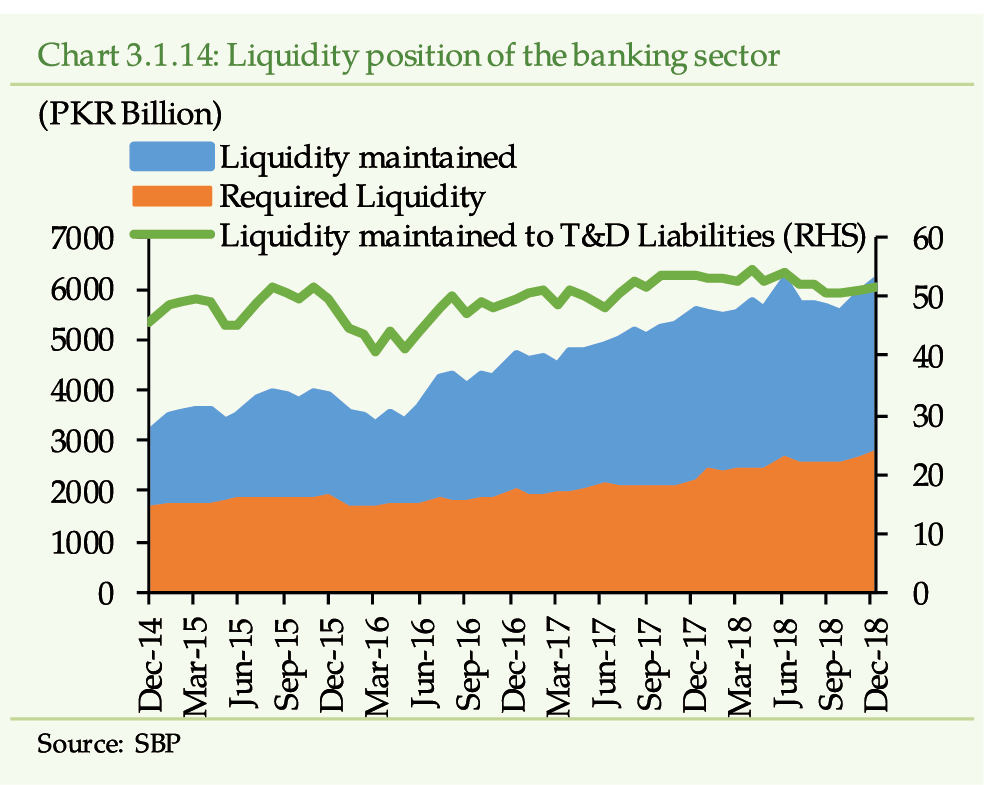
as
the banks ability, to meet short-term obligations improve
The banks renewed interest in MTBs has reshaped
the asset-liability maturity profile of the banking sector in CY18 (Chart
3.1.15). The asset-liability gaps reveal that banks ability to meet
short-term commitments has improved. On the other hand, the negative gap
for maturity over one year has further widened in CY18 due to net-maturity
of PIBs. However, once the interest rates stabilize, banks interest in
PIBs may restore leading to a reduction in this gap.
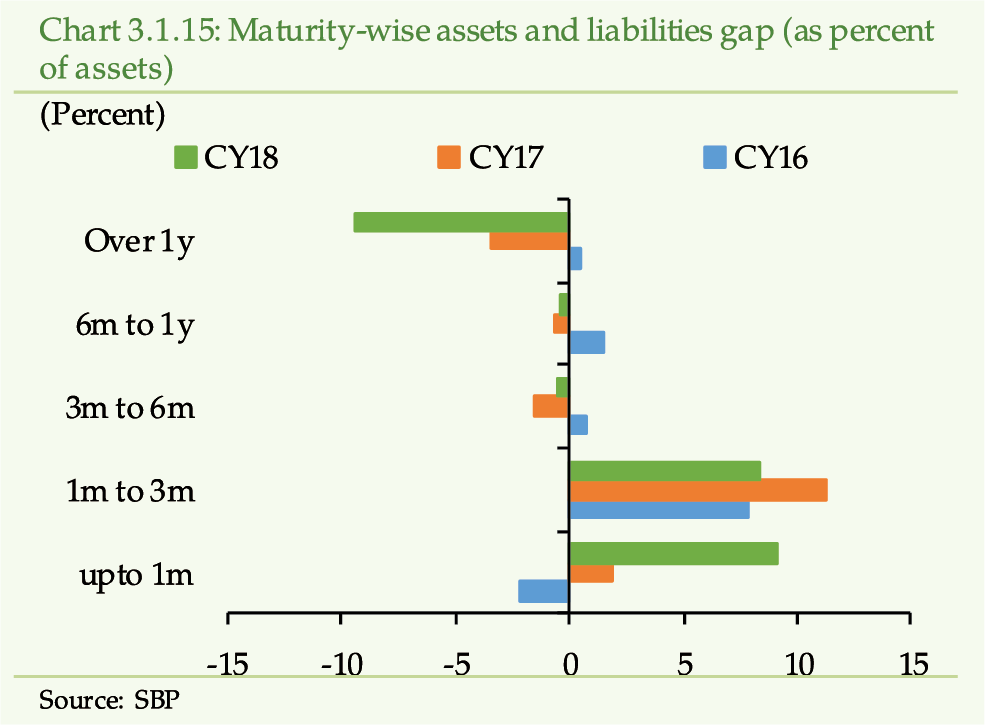
However,
smaller banks ability to meet obligations has receded
The liquidity profile of the bottom two quartiles
of banks (smaller banks) has been weakening during the last few years (Table
3.1.3). There has been quite a steep fall in liquidity ratio of both
small and very-small banks in CY18. This is because some of these banks
have utilized their liquid assets to fund their operations.
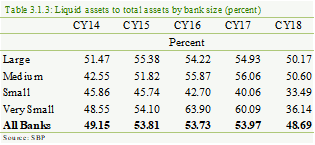
5. Profitability
The profitability of the banking sector has moderated
for yet another year. Profit (after tax) at PKR 149 billion is down by 5.36
percent in CY18. This decline has resulted from (a) higher provisioning
expense on bad debts and diminution in the value of investments; (b) decline
in net gain on sale of securities; (c) reduced dividend income; and (d)
rise in administrative cost including some extra ordinary expense borne
by a couple of large banks (e.g. higher legal and professional charges and
expense on defined benefit pension plan etc.).
[15]
Accordingly, all profitability indicators have shown
slight deterioration. The after-tax ROA and ROE have dropped to 0.81 percent
and 10.71 percent in CY18, respectively, from 0.92 percent and 11.53 percent,
respectively, in CY17 (Chart 3.1.16). The cost to income ratio has
slightly inched up to 60.21 percent in CY18 compared to 57.14 percent in
CY17. In addition, the bank-wise distribution of after tax profit shows
that the number of loss making banks has increased to 7 in CY18 from 5 in
CY17. However, on aggregate, these banks have 3.70 percent share in the
asset base of the banking sector and most of these are under the restructuring
process.
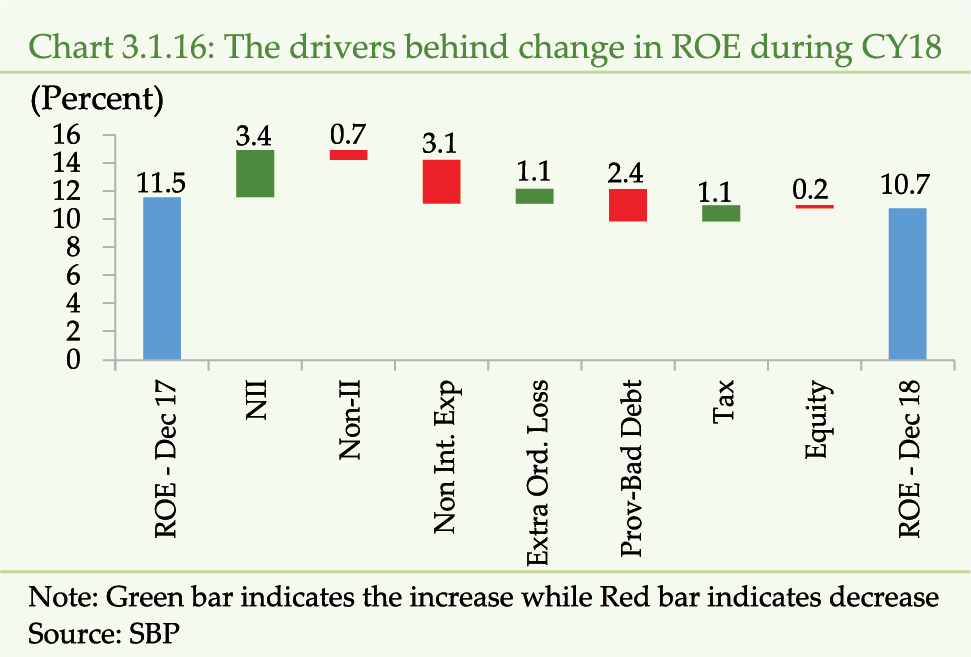
but
earnings flow seems to have stabilized
Despite moderation in profitability the Net Interest
Margin (NIM), has improved from 3.34 percent in CY17 to 3.40 percent in
CY18. In addition to healthy growth in advances, the policy rate hikes from
second quarter of CY18 onwards, has increased the lending rates. This has
bolstered the interest earnings of the banks as Net Interest Income (NII)
has increased by 9.27 percent during CY18 from 2.90 percent in CY17. Moreover,
lagged impact of increase in rates on repricing of existing outstanding
loans is expected to further push the NIM upwards.
Further, with the sizeable maturity of long-term
government bonds, the expected volume of losses on the sale of lower valued
remaining securities, in the current rising interest rate scenario, may
be limited. (Chart 3.1.17).
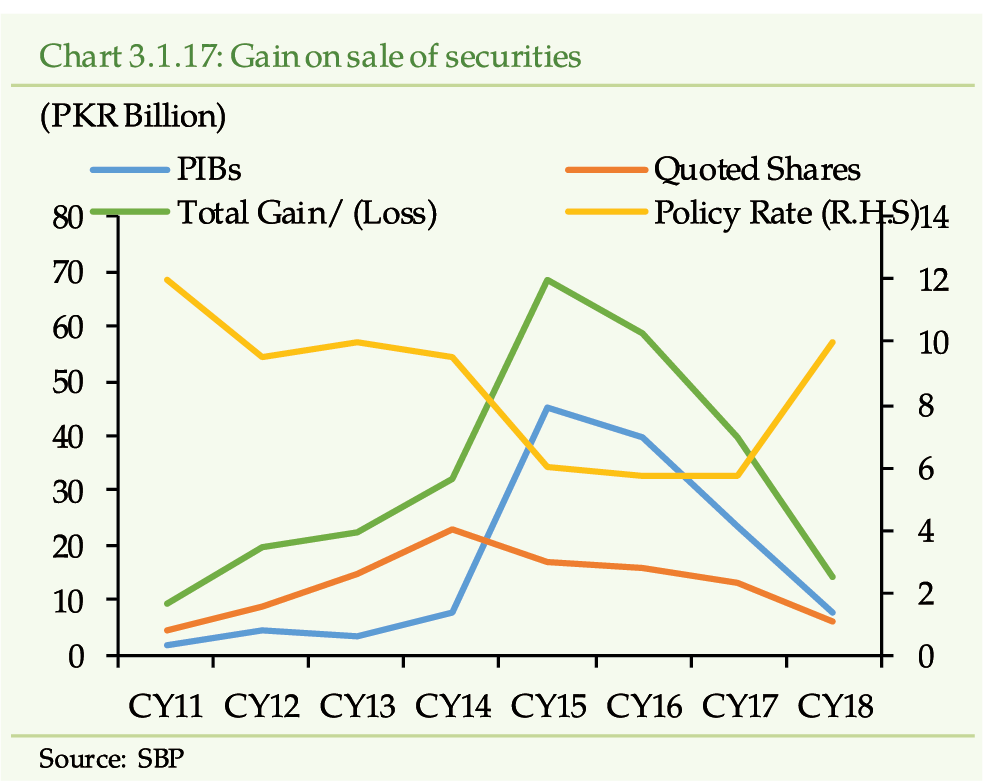
With
the monetary tightening, banks adopted profit optimization strategies
The mark-to-market yields on government papers rose
significantly before five out of six SBP monetary policy announcements during
CY18 (Chart 3.1.18). This advocates that banks had a strong rate
rise expectation before the announcement of each monetary policy.
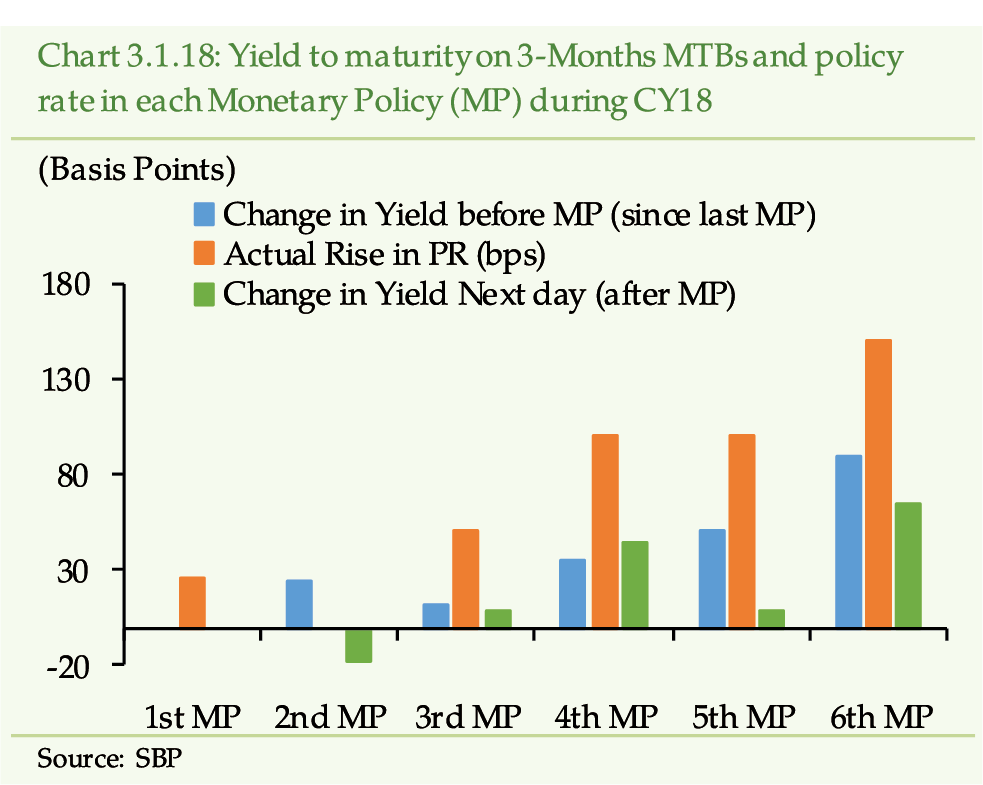
In this scenario, banks have mostly preferred to
invest in short-term instruments (3 month MTBs) and divest long-term instruments
(PIBs) to limit deficit on revaluations (Chart 3.1.19). This behavior
has also exhibited in primary auctions, where banks demanded higher average
yields on PIBs (than offered coupon rates) to compensate for the expected
revaluation of PIBs.
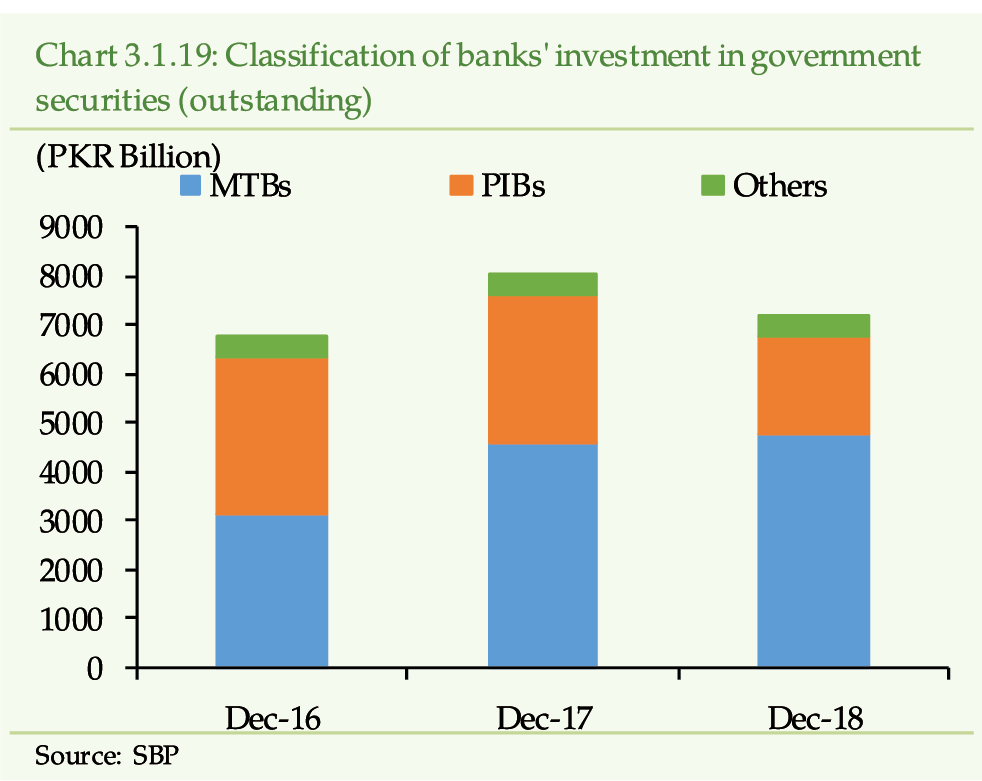
However,
the realization of credit risk remains a key concern for profitability
A sizable amount of provisioning charges has squeezed
the bottom line of the banks. After accounting for the provisioning charges
against NPLs and diminution in the value of investments, the growth in NII
slides to 2.8 percent, which is lower than 3.3 percent in CY17.
along
with rising operational cost
In addition to provisions charge, surge in administrative
expenses has also affected the overall profitability. The administrative
expense of the banking sector has exhibited a growth of 10.96 percent against
3-years (CY15-17) average of 8.40 percent (Table 3.1.4). Besides
costs associated with normal operations such as branch expansion costs,
the one-off costs (e.g. legal charges, postretirement benefit expenses)
have also increased. As a result, both the fixed and variable components
of administrative expenses have witnessed a surge.
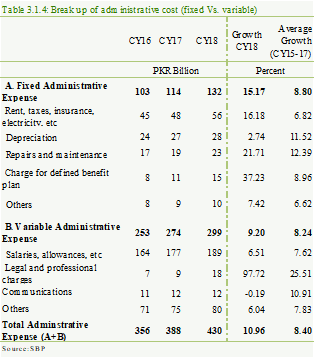
6. Solvency
Despite emerging risks during CY18, the banking
sector has remained resilient. The Capital Adequacy Ratio (CAR) of the banks
has inched up to 16.19 percent as of end CY18 from 15.76 percent in CY17;
well above the minimum local requirement of 11.9 percent and international
benchmark of 10.50 percent. The tier 1 CAR has stood at 13.24 percent by
end CY18 (Chart 3.1.20). The leverage ratio (LR) of the banking sector
at 4.80 percent as of end CY18 is well above the minimum required level
of 3.0 percent.
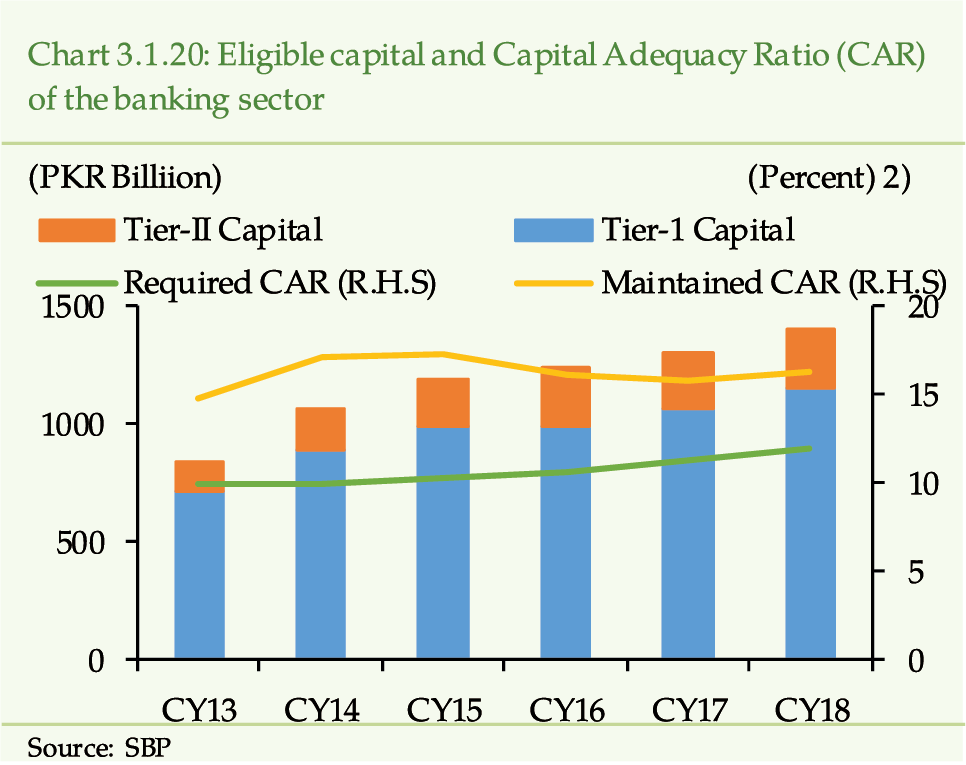
as
banks continue to take measures to enhance capital
As per phased implementation of Basel III, banks
were required to raise their CAR to the minimum level of 11.9 percent (including
capital conservation buffer of 1.9 percent) by end of CY18.
[16]
To comply with this requirement, several banks have
enhanced additional Tier I capital through issuance of Basel III qualifying
instruments (such as TFCs, Sukuk etc.) to the tune of PKR 37 billion in
CY18 (PKR 8 billion in CY17). The tier II capital has slightly moved up
due to revaluation of fixed assets and foreign exchange revaluation reserves.
[17]
The rise in retained earnings have also contributed
to the overall increase in eligible capital of the banking sector, which
has by 7.69 percent against 4.82 percent increase in total risk weighted
assets leading to a higher CAR.
The bank-wise distribution of CAR reveals a strong
solvency position as most of the banks have maintained CAR above 15 percent
(Table 3.1.5). Further, the banks with higher CAR are mostly large
and medium sized banks maintaining the bulk of the banking assets.
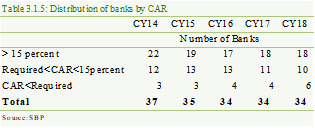
Also,
banks respond to tighter macrofinancial conditions by limiting the growth
of Risk Weighted Assets (RWAs)
Despite robust growth in lending activity (21.27
percent), the credit risk weighted assets have expanded at a slower pace
of 10.67 percent (Chart 3.1.21).
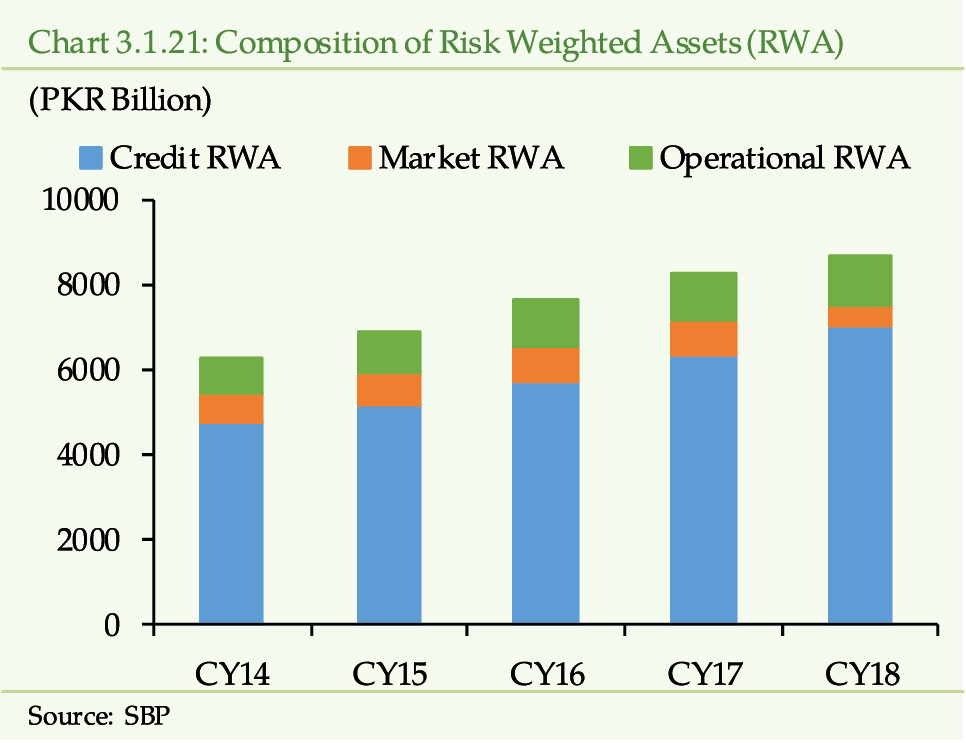
This is because, banks have shifted lending portfolio
from unrated exposures (attracting 100 percent or 125 percent risk weight)
to rated categories with lower risk weights (20 percent and 50 percent)
(Chart 3.1.22). Shifting exposures towards better rating categories
is a welcome development from the risk management perspective as it indicates
lower probability of default of corporate clients of the banks.
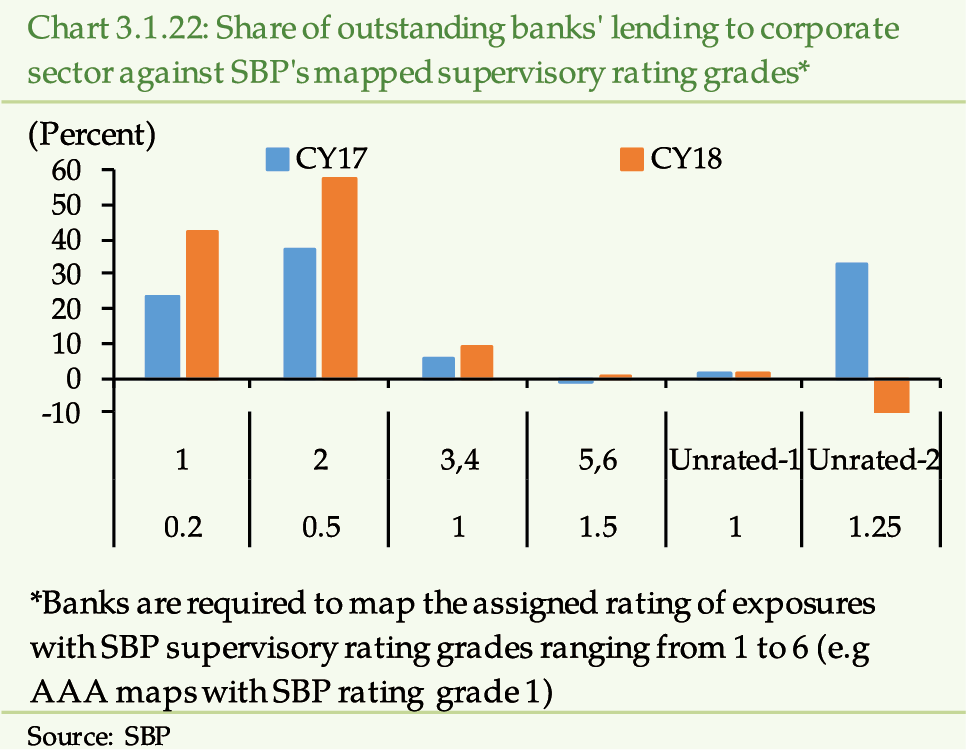 A considerable reduction in market risk weighted assets has further subdued
the overall growth in RWA. The larger reduction in market risk weighted
exposure has taken place against interest rate risk due to maturity of PIBs
during the year.
[18]
Some erosion of banks exposure on equity investment
has also reduced the market risk under this specific segment (Chart 3.1.23).
A considerable reduction in market risk weighted assets has further subdued
the overall growth in RWA. The larger reduction in market risk weighted
exposure has taken place against interest rate risk due to maturity of PIBs
during the year.
[18]
Some erosion of banks exposure on equity investment
has also reduced the market risk under this specific segment (Chart 3.1.23).
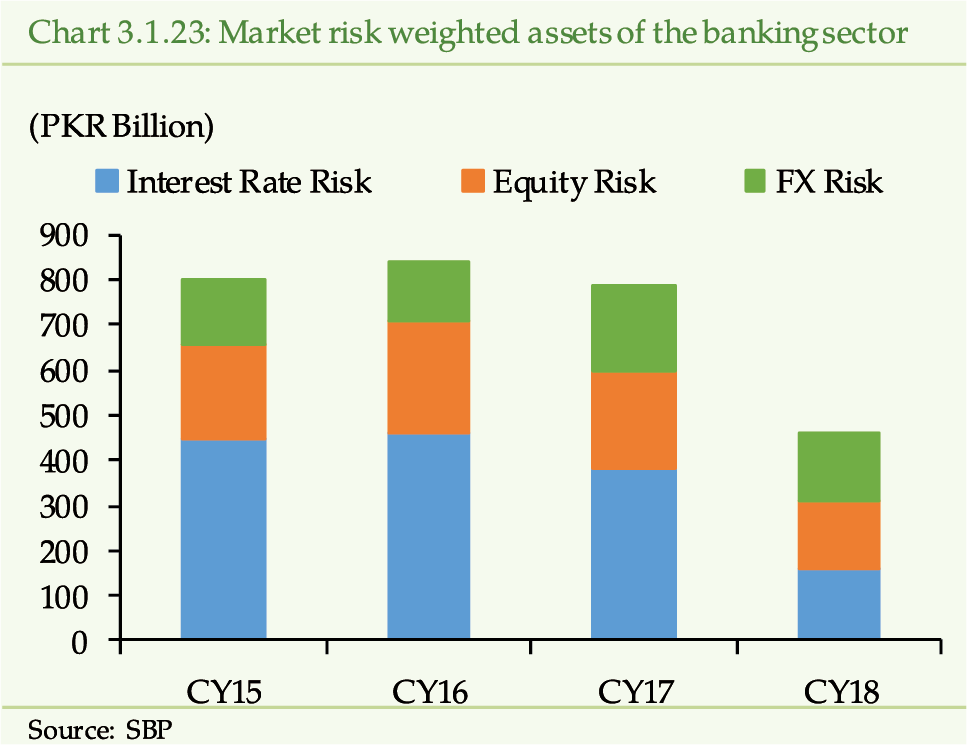
The operational risk weighted assets (ORWA) have
shown steady growth, however. Since most of the banks are using Basic Indicator
Approach (BIA), the annualized audited average gross income (of last three
years) forms the basis for estimation of ORWAs. As such, this segment has
remained the least volatile over time.
SBP
has designated three large banks as D-SIBs
To address the risks emerging from the cross sectional
dimension of the systemic risk, SBP has issued a framework for Domestic
Systemically Important Banks (D-SIBs) in April 2018.
[19]
Accordingly, SBP has designated three large banks
as D-SIBs. These banks are required to meet enhanced supervisory and regulatory
requirements, including the Higher Loss Absorbency Capital surcharge in
the form of additional common equity tier-1 capital (CET1). Besides the
designated D-SIBs, the branches of Global-Systemically Important Banks (G-SIBs)
operating in Pakistan will hold additional CET1 capital against their risk-weighted
assets in Pakistan at par with what is applicable on their respective G-SIBs.
[20]
The
banking sector of Pakistan has reasonable global standing in terms of financial
soundness
The cross-country data of financial soundness indicators
reveals that Pakistan stands at a comfortable level in terms of solvency,
liquidity and earnings (Table 3.1.6). However, despite consistently
declining over time, its NPL ratio remains high compared to some of the
AEs and EMDEs. However, new laws have been introduced in the last few years,
which are expected to improve the debt recovery regime.
[21]
Further, net-NPLs to net-advances ratio stands at only 1.4 percent,
indicating, low probability further equity erosion on account of credit
risk.
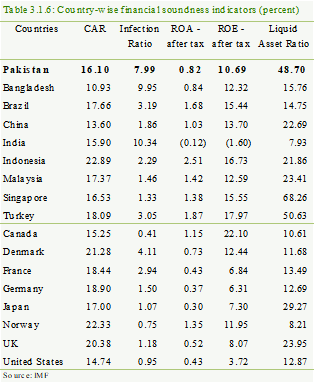
Banking
infrastructure is steadily expanding
The banking infrastructure and its growth pattern
is a useful indication of the current as well as future growth prospects
of the banks. The reviewed year has witnessed a broad-based and steady growth
in the banking infrastructure i.e. brick and mortar based banks branches,
ATMs, and electronic cards (Table 3.1.7). The increasing share of
online branches overtime is also a welcome development, as it will improve
banking efficiency.
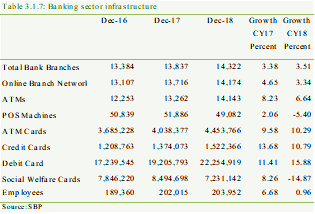
Future outlook
The banking outlook depends a lot on the future
economic prospects and the corresponding policy responses. The monetary
tightening towards the end of CY18 and first half of CY19 may lead to repricing
of loans. This may improve the net interest income and, thus, profitability
and solvency of the banking sector. On the other hand, it may dent the repayment
capacity of the borrowers, thus, escalating the credit risk. Further, considering
the contraction in LSM during July-March FY19 reflecting the dwindling performance
of non-financial corporate sector, suggest that the odds of defaults are
increasing. Further, any downgrade of a sizeable portion of NPLs parked
under doubtful and substandard categories could raise the provisioning
expense for the banks. Thus, the credit risk remains paramount, going forward.
Besides implications arising from the realization
of credit risk, the profitability of the banking sector depends upon the
costs associated with mitigating the emerging operational risks and the
interest rate dynamics. The mitigating measures against various risks such
as compliance with AML/CFT related laws and regulations, fortifying systems
against cyber-attacks, enhanced due diligence to ward-off fake/benami accounts,
seeking legal remedies to manage challenges in overseas operations, etc.
are all costly. The banks investment behavior in government securities and
the interest earned there against are largely dependent on interest rate
dynamics. Moreover, fiscal measures (such as super tax) has implications
for the banks after-tax returns and solvency.
In order to meet the growing financing demand of
public and private sector, banks need to renew their focus on deposit mobilization.
The sizeable rise in MSR may help in restoring the deposit growth, though.
Like CY18, the enhanced CAR requirement (from current
11.9 percent to 12.5 percent) by the end of CY19, given slowdown in profitability,
may compel banks may have to focus on raising capital through issuance of
Basel III qualifying instruments. Banks, particularly small sized ones,
will need to formulate concrete and time bound capital enhancement plans
to meet their capital requirements. The strong NSFR and LCR of banks suggest
that they will remain compliant with the Basel III liquidity requirements.
SBP, in cognizance of various emerging risks, has
taken a number of regulatory and supervisory measures to mitigate their
impact (See Box 2).
Box 4 FATF and
AML/CFT Regime in Pakistan
Background
The Financial Action Task
Force (FATF) is an inter-governmental policy-making body that was established
in 1989 to help protect the integrity of the international financial system
against misuses for money laundering and terrorist financing. The FATF has
developed key recommendations to guide the countries on the development
and implementation of effective Anti-Money Laundering and Combating the
Financing of Terrorism (AML/CFT) regimes in their jurisdictions. It also
assesses the compliance of different jurisdictions with these recommendations
and assesses the effectiveness of AML/CFT frameworks to identify any weaknesses.
If a jurisdiction is identified as having strategic deficiencies in its
AML/CFT regime, other jurisdictions and entities (which recognize the FATFs
Recommendations as the international standards) may enhance scrutiny and
restrict trade and financial transactions with such identified jurisdiction.
This move encourages the identified jurisdiction to plug the gaps and enhance
compliance with the AML/CFT standards. Furthermore, FATF calls on its members
to apply counter-measures against natural and legal persons from jurisdictions
identified on FATFs public statement as posing substantial ML/TF Risks
to the global financial system.
The FATF is supported by
a network of FATF-Style Regional Bodies (FSRBs) in implementing and enforcing
its Recommendations. The Asia/Pacific Group on Money Laundering (APG) is
one such FSRB, which is an autonomous inter-governmental organization, consisting
of 41 member jurisdictions, which ensures the effective implementation of
these international standards. While Pakistan as such is not a member of
the FATF, the country is associated with it through membership of the APG,
since 2000.
[22]
,
[23]
Placement on Grey-List
In June 2018, Pakistan
was identified as a jurisdiction with strategic AML/ CFT deficiencies.
[24]
Pakistan has made a high-level political commitment to work with
FATF and APG to implement an action plan to strengthen its AML/ CFT regime
and address the strategic counter-terrorist financing-related deficiencies
by demonstrating that:
[25]
-
terrorism financing (TF) risks are properly identified and assessed, coordination on TF risks is improving, and law enforcement agencies (LEAs) are investigating the widest range of TF activity
-
TF prosecutions result in effective, proportionate and dissuasive sanctions, and that the capacity and support for prosecutors and the judiciary has been enhanced;
-
remedial actions and sanctions are applied in cases of AML/ CFT violations;
-
enforcement action is being taken against illegal money or value transfer services (MVTS);
-
authorities are identifying cash couriers and enforcing controls on illicit movement of currency;
-
targeted financial sanctions are being effectively implemented (including enforcement actions against violations); and
-
facilities and services owned or controlled by designated persons are deprived of their resources and the usage of the resources.
-
Pakistan is working to implement the action plan by September 2019 to negotiate an exit from the grey-list. In the interim, the FATFs International Cooperation Review Group (ICRG) and APG have been holding a series of meetings with Pakistani representatives to monitor Pakistans progress vis-à-vis the action plan.
Pakistans AML/CFT
Regime
Pakistani authorities give
high importance to the effectiveness of AML/CFT regime. In this regard,
SBP is taking initiatives, on regular basis, for strengthening the overall
AML/CFT regime. SBP introduced AML/ CFT Policy Framework for its regulated
institutions in 1990s and over the years, it has been strengthened in the
light of emerging best practices.
The AML law in the country
was promulgated in 2007, which defines the legal obligations in respect
of money laundering and terrorist financing, and enjoins the roles and powers
of different stakeholders and law enforcement agencies. To facilitate implementation
of the law, a full-fledged Financial Monitoring Unit (a financial intelligence
unit) receives suspicious transactions reports (STRs) and currency transactions
reports (CTR) from different reporting entities and (after due analysis)
refers the potential cases of money laundering and terrorist financing to
the respective investigation agencies in the form financial intelligence
for further examination/ investigation and prosecution.
While Pakistans legal and regulatory framework is quite comprehensive, the country is currently working on further enhancing the effectiveness of the AML/ CFT regime. The country has recently taken a number of significant measures and initiatives to further strengthen the AML/ CFT framework. In this regard, SBP has issued or strengthened the following set of guidelines and instructions to its regulatees:
-To align AML/CFT Regulations with the Financial Action Task Force (FATF) Recommendations, various provisions of the regulations have been ended to provide further clarity on requirements relating to customer due diligence (CDD), correspondent banking, wire transfers/ funds transfers and minimum documents required for opening accounts by customers. [26]
-For strict compliance of Statutory Regulatory Orders (SROs) and Notifications issued by the Government of Pakistan under the United Nations (Security Council) Act, 1948 and Anti-Terrorism Act (ATA), 1997, detailed guidelines for ECs have been issued on Targeted Financial Sanctions (TFS) for prevention of Terrorism Financing and Proliferation Financing under UNSC Act, 1948 and ATA, 1997. [27]
-Banks have been advised that sponsor shareholders/beneficial owners, directors, Presidents and key executives (persons subject to FPT) will become disqualified if they are designated/proscribed or associated directly or indirectly with designated/proscribed entities/persons under United Nations Security Council Resolution or Anti-Terrorism Act 1997. [28]
-Enhanced the scope of Know Your Customer (KYC) standards and documentation requirements for ECs. [29]
SECP and other bodies have
issued the following set of instructions and guidelines for strengthening
AML/CFT for entities in the non-bank financial sector and other corporate
entities:
-Associations with Charitable and Not for Profit Objects Regulations, 2018 have been issued to specify procedures to grant licenses to associations with charitable and not for profit objectives, incorporation of association as a public limited company, fit and proper criteria, provision for revocation of license and winding up, and monthly reporting requirements.
-AML/CFT Regulations, 2018 have been issued to provide a consolidated set of regulations for financial institutions under the ambit of the SECP including Modarabas, Insurers, Non-Bank Financial Companies (NBFCs), etc. to harmonize the AML/ CFT regime. The Regulations have adopted a risk-based approach towards combating ML/TF, and are focused on high risk areas including politically exposed persons, legal persons, legal arrangements with complex ownership structures, etc.
-Anti Money Laundering and Countering Financing of Terrorism Regulations, 2018 have been amended to bring further clarity on various aspects including beneficial ownership, legal persons, Counter-measures against high risk countries, etc.
-AML & CFT Guidelines for Real Estate Agents 2018 have issued to bring the real estate agent into the regulatory ambit of AML/ CFT regime. The guidelines recommend complying with AML laws/ regulations while reporting Suspicious Transactions and Cash Transactions, implementing CDD measures, keeping proper records, etc.
Pakistan Post, being a
saving bank and money transfer services provider to the general public,
has issued AML/CFT Regulations in October 2018 to deter the risks of money
laundering and financing of terrorism. Similarly, the designated non-financial
business and professions (DNFBPs) such as real estate agents, charities,
jewelers, etc. have been brought under the ambit of AML/CFT regime.
From the implementation
perspective, regulatory bodies and other government entities are taking
measures for effective enforcement of the AML/CFT related regulation. SBP
is strictly enforcing its regulations and instructions and is taking penal
actions against such regulated institutions, which have been found delinquent
during the supervisory process. These institutions have also taken disciplinary
actions against concerned employees including issuing reprimands, incremental
stoppage, etc.
Similarly, the Federal
Board of Revenue (FBR) has taken extensive measures to counter illicit movement
of currency
[30]These measures include launch of an extensive risk mitigation
strategy to curb cash smuggling, increased currency seizures, implementation
of Currency Declaration Systems (CDS) at international entry/ exit points,
etc.
Overall, Pakistans AML/
CFT regime has further improved during the period under review. Presently,
adequate legal and technical infrastructure is in place and the government
is highly committed to address any remaining deficiencies in the AML/CFT
regime. It is hoped that these enabling factors coupled with ongoing efforts
to enhance the capacities of relevant agencies as well as strengthen inter-agency
cooperation will help to deliver on the action plan and address those strategic
deficiencies.
[1]
The 16th and 17th waves of Business Confidence
Index Survey (BSI) conducted by Overseas Investor Chamber of Commerce (OCCI)
in May and December 2018, respectively, showed a significant decline in
the overall business confidence Score (BCS) in both waves of the surveys.
Similarly, SBP Business Confidence Survey also indicates the deterioration
in business confidence during Aug-18 (i.e. first published survey) and April-19.
[2]
[2]
Due to excess liquidity, (a) the average deviation between ONR and
SBP policy rate has been only 0.003 bps in CY18 compared to 6.36 bps in
CY17, (b) weekly data shows higher average (1.22 trillion) outstanding stock
of cash and banks balance with other banks (including treasury bank) in
CY18 compared to CY17 (1.09 trillion).
[3] The average monthly spread between weighted average lending rates (excluding zero markup and interbank) on fresh advances and weighted average deposit rates (including zero markup and excluding interbank) on fresh deposit has reduced from 4.13 percent in CY17 to 4.08 percent in CY18 (http://www.sbp.org.pk/ecodata/
[4] Source: The State of the Pakistans Economy: First Quarterly Report FY19
(http://www.sbp.org.pk/reports/
quarterly/fy19/First/Chap-3.pdf)
[5]
SBP estimates based on Vector Autoregressive (VAR) models.
[6]
Systemic risk refers to a widespread disruption to the provision
of financial services due to partial or full impairment of the system that
might have serious negative implications for the real economy. It has two
major component; (a) pro-cyclical systemic risk: the vulnerabilities built
up over time and (b) structural systemic risk: vulnerabilities arising from
interconnectedness and distribution of risk within the financial system
at a point in time.
[7] As per IMF-BIS-FSB, if banks are significant providers of credit to the economy, systemic risk typically surround the banking system.
https://www.imf.org/external/np/pp/
[8] Table 3.11, Classification of Scheduled Banks' Advances by Securities Pledged, SBP Statistical Bulletin, February 2019
(http://www.sbp.org.pk/reports/
[9]
For example, Basel III capital and liquidity standards.
[10]
The minimum rate on saving deposits is directly linked to
SBP repo rate (i.e. floor of the SBP interest rate corridor). As the monetary
policy tightens, the MSR rises.
[11]
About 41.6 percent of the deposits are of very large size (PKR
10 million and above).
[12]
The interconnectedness is measured by two major indicators i.e.
(1) interbank call borrowing plus call lending and (2) Other interbank financial
liabilities plus assets: total borrowings and interbank lending plus total
deposits (financial institution) minus call borrowings minus repo borrowings
from SBP minus call lending.
[13]
Source: Bloomberg
[14]
Liquid assets are consist of (a) cash and due from
treasury banks, (b) balance with other banks, (c) call money lending, (d)
reverse repos lending and (e) all government securities.
[15]
Though, extra ordinary items expenses in CY18 (PKR
9.0 billion) are less than CY17 (PKR 23.7 billion), they are still significantly
higher than their historical trend.
[16]
Banks are required to raise their CAR at 12.5 percent
by end CY19. BPRD Circular No.6 of 2013 (http://www.sbp.org.pk/bprd/2013/C6.htm)
[17]
However, yearly flows of overall revaluation reserves turned
into negative due to revelation deficit on AFS securities.
[18]
The instrument of longer maturity attract higher market risk
weight under Basel instructions for capital adequacy calculation.
[19]
The framework follows two steps approach; in first step, a sample
of banks based on quantitative and qualitative criteria is identified. In
the second step, among these sample banks, D-SIBs are designated based on
Size, Interconnectedness, Substitutability and Complexity.
[20]
http://www.sbp.org.pk/press/2018/Pr-14-Jun-18.pdf
[21]
For example, Financial Institutions (Recovery of Finances) (Amendment)
Act 2016, Corporate Restructuring Companies Act 2016, Financial Institutions
Secured Transaction Act 2016 and Corporate Rehabilitation Act 2018.
[22]
http://www.apgml.org/about-us/page.aspx?p=91ce25ec-db8a-424c-9018-8bd1f6869162
[23] http://www.fatf-gafi.org/pages/
asiapacificgrouponmoneylaunderingapg.html
[24]
http://www.fatf-gafi.org/countries/d-i/iraq/documents/fatf-compliance-june-2018.html
[25]
https://www.fatf-gafi.org/publications/high-riskandnon-cooperativejurisdictions/documents/fatf-compliance-june-2018.html
[26]
BPRD Circular Letter No. 16 of 2018
[27]
FE Circular No. 09 of 2018
[28]
BPRD Circular No. 09 of 2018
[29]
EPD Circular Letter No. 08 of 2018
[30]
https://fbr.gov.pk/pr/effective-steps-taken-by-fbr-customs-operatio/132037
3.2
Performance and Risk Analysis of the Islamic Banking Industry
While global banking sector
has seen deceleration, Islamic Banking Institutions (IBIs) in Pakistan have
shown healthy growth of 17 percent. In the domestic context, the growth
in assets of IBIs has outpaced those of the conventional banks, mainly due
to surge in financing. IBIs have improved the diversity in Shariah modes
of financing, particularly in Profit and loss sharing modes. Most of the
increase in financing is funded by strong growth in deposits. Improved asset
quality and rise in profitability have enhanced the soundness and stability
of IBIs. Liquidity deployment in the short term remains the key challenge
faced by the IBIs, while need remains for improving the suit of products
for increasing financing to SME and agriculture sector.
The global Islamic Financial Services
Industry (IFSI) is decelerating
On the Global landscape, Islamic Financial Services
Industrys (IFSI) assets crossed the landmark of USD 2 trillion and reached
USD 2.19 trillion at the end of June, 2018 compared to USD 1.89 trillion
at the end of June, 2017.
[1]
The growth has been recorded in all the three sectors
i.e. Islamic Capital Markets, Takaful and Islamic Banking. However, the
pace of overall growth in dollar value of IFSIs has slowed down (6.9 percent
during Jul, 17-Jun, 18 versus 8.5 percent during Jul,16-Jun,17) mainly because
of exchange rate depreciation in various jurisdictions. The IFSI has remained
sound and stable, despite emergence of various risks including continued
trade tensions, inflation and foreign exchange exposures.
Among the IFSIs, the global Islamic banking assets
hold around 70 percent share. However, the growth in the assets of Islamic
banks has decelerated to 4.16 percent during CY18 compared to 10.03 percent
increase in CY17 (Table 3.2.1).
[2]
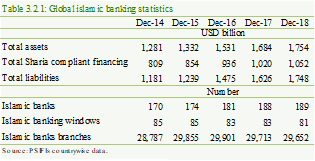
In tandem with assets deceleration, growth in Shariah
compliant financing has also slowed down to 3.09 percent in CY18 as compared
to 8.95 percent in CY17. The asset quality of global Islamic banks, on an
aggregate level, has somewhat strengthened
The profitability of the global Islamic banking
industry seen marginal decline over the year. The ROA marginally declined
to 1.86 percent during CY18 from 1.92 percent in CY17, while ROE has declined
by 124 bps to 15.62 percent in CY18.
[3]
Further, the CAR of Islamic banking industry has remained strong
at 12.3 percent, which is well above the international benchmark of 10.5
percent. Similarly, Islamic banking sector of most of the jurisdictions
have robust capital positions.
Despite tightening of domestic macrofinancial
conditions, IBIs have outpaced conventional banks in their asset expansion
The assets of domestic IBIs have continued to grow
in CY18, relatively faster than their conventional counterparts, but at
a slower pace than the last year owing to growing macroeconomic challenges
(Table 3.2.2). The assets of IBIs have increased by 17.02 percent
during CY18 (22.60 percent in CY17), as opposed to the growth in assets
of conventional banks of 5.94 percent. This has mainly been due to significant
increase in financing.
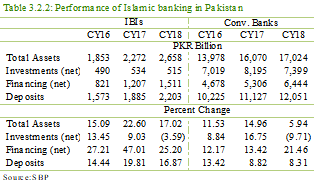
As a result, the share of Shariah compliant banking
assets in the total banking assets has increased to 13.51 percent in CY18
compared to 12.39 percent in CY17.
Financing has increased rapidly
As opposed to 21.46 percent growth in advances
of conventional banks, the IBIs financing has increased by 25.20 percent
during CY18. Resultantly, the share of Shariah compliant financing in total
advances has increased to 18.99 percent in CY18 (18.53 percent in CY17 and
9.19 percent in CY14). This expansion has contributed to around 80 percent
in the growth of total assets of the IBIs.
The relatively better financial intermediation
by IBIs could be due to higher preference of customers for Shariah-compliant
products, availability of low cost funding, and a better credit risk assessment.
Besides, lack of Shariah compliant investment opportunities is encouraging
IBIs to focus more on their core financing activities. As a result, there
is high growth in financing backed by the reasonable increase in deposits.
The financing to deposit ratio of IBIs have increased to 68.58 percent in
CY18 from 64.02 percent in CY17.
Private sector financing has maintained healthy
growth over the years with another 32.27 percent rise in CY18 in comparison
to 24.93 percent in CY17 (Chart 3.2.1). In tandem with the private
sector, the share of public sector financing has also been increasing mainly
because of commodity operations. The major portion i.e. 98.69 percent is
outstanding against wheat financing. However, the financing entails no credit
risk as the repayment is guaranteed by the government department(s).
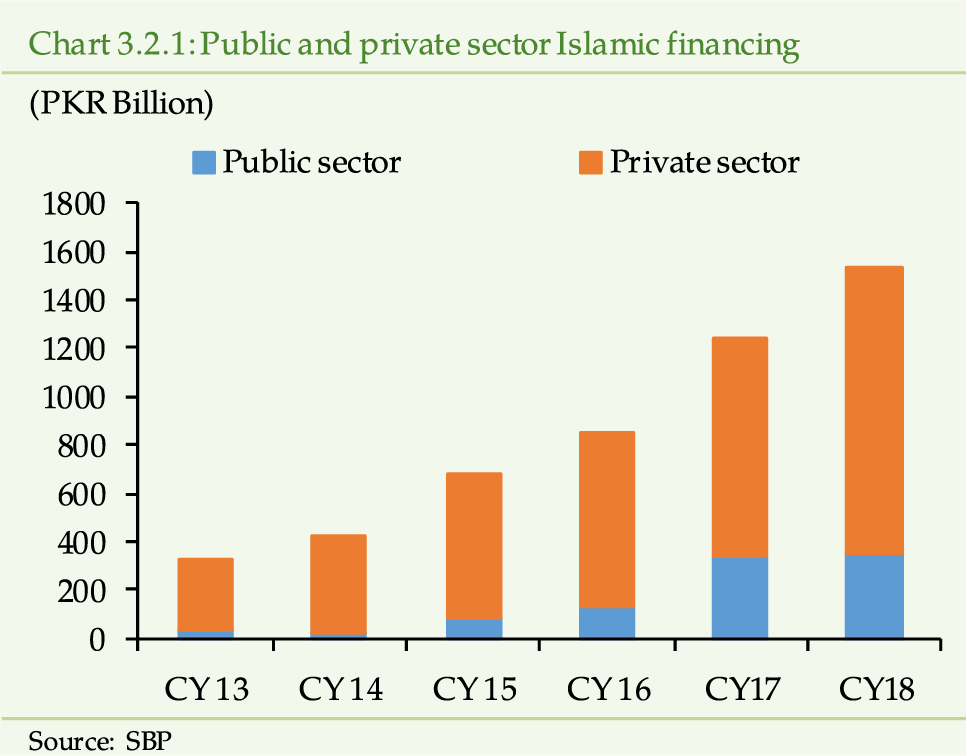
while diversity in financing continues
to grow
IBIs are extending financing under three broader
modes i.e. Trade based, Lease based, and Profit and Loss sharing based.
There are various Shariah compliant products within each mode to cater for
the diverse credit needs of the individuals and institutional borrowers.
Over the years, the profit and loss sharing modes of financing have observed
increased share in the overall financing. The share of Musharaka and Diminishing
Musharaka has increased from 43.6 percent in CY14 to 53 percent in CY18.
Within the various modes of financing, Diminishing
Musharaka represents 1/3rd of the total financing during CY18
(Table 3.2.3). While the share remains high, the concentration in
this particular mode is not alarming as it offers diverse range of financing
product backed by tangible assets including machinery, construction of storage
facility/ sheds/commercial or residential buildings etc.
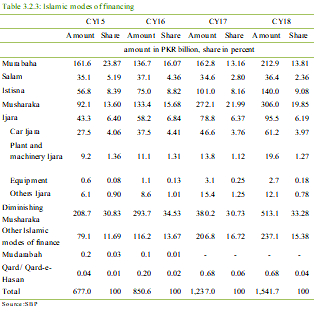
Corporate sector remains major borrower
In terms of segment-wise financing, the IBIs have
served the corporates more than any other segment (88.96 percent of net
financing in CY18). This is despite some deceleration in corporate financing
(31.02 percent growth in CY18 versus 32.64 percent in CY17) (Table 3.2.4).
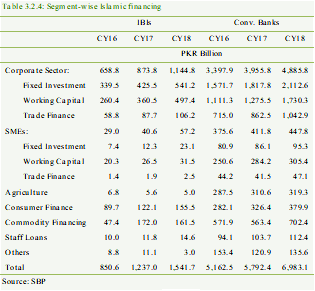 However, sectoral analysis reveals that the financing is well diversified.
The largest user of the Islamic financing is the energy sector with the
share of 17.70 percent in total financing in CY18 followed by textile (12.97
percent) and individuals
[4]
(11.42 percent) (Chart 3.2.2). During CY18, the highest
growth of 34.84 percent has been registered in energy sector followed by
individuals (29.27 percent) and textile (23.91 percent).
However, sectoral analysis reveals that the financing is well diversified.
The largest user of the Islamic financing is the energy sector with the
share of 17.70 percent in total financing in CY18 followed by textile (12.97
percent) and individuals
[4]
(11.42 percent) (Chart 3.2.2). During CY18, the highest
growth of 34.84 percent has been registered in energy sector followed by
individuals (29.27 percent) and textile (23.91 percent).
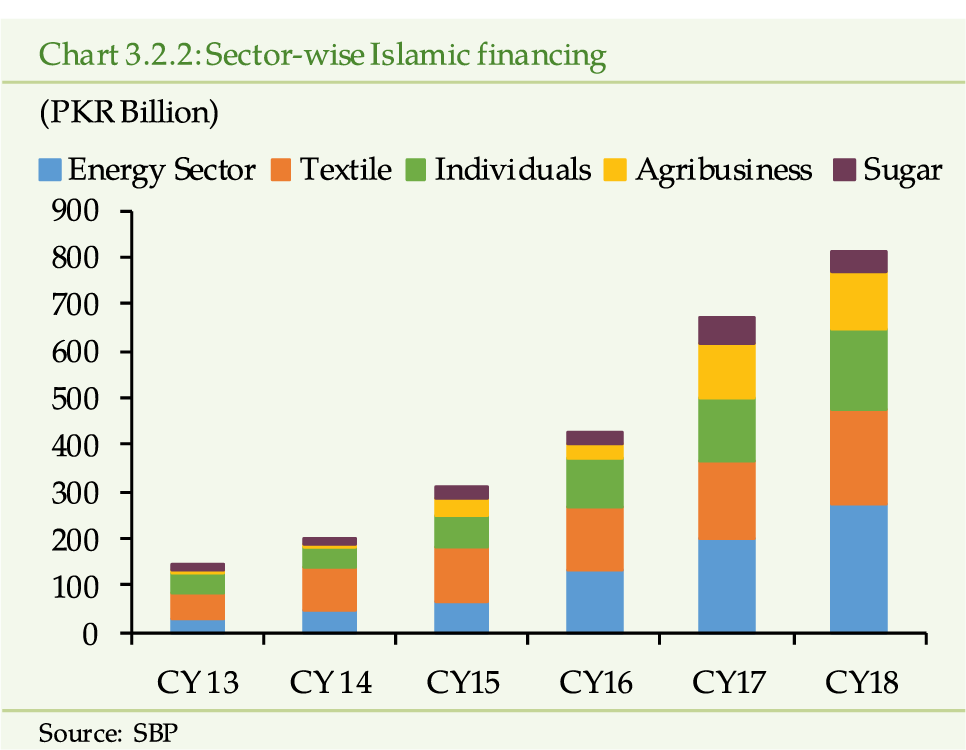
Despite marginal slowdown in Islamic corporate
financing, the share of the same in total corporate financing has risen
to 18.98 percent in CY18 from 18.09 percent in CY17.
while share of financing to SMEs and
agriculture remains low
The financing to SMEs has witnessed exponential
growth over the last few years. SME financing has increased by 40.64 percent
in CY18 (39.96 percent in CY17). The rise in SME financing can be attributed,
among others, to indicative financing targets advised by SBP.
[5]
The outstanding SME Islamic financing has increased from PKR
29 billion in CY16 to PKR 57 billion in CY18. Accordingly, the share of
IBIs in overall SME financing has increased to 11.32 percent in CY18 from
7.18 percent in CY16. However, the share of SME financing in total Islamic
finance portfolio remain low at 3.71 percent.
Agriculture is the key contributor to the GDP of
Pakistan. However, Agri-finance have less than 0.5 percent share in IBIs
financing and is lagging behind 5 percent share in conventional banks lending.
Even the share of Islamic agriculture financing in overall agriculture financing
has declined to 1.55 percent to CY18 from 1.77 percent a year earlier. While
SBP has issued detailed guidelines on Islamic financing for agriculture,
IBIs are still to utilize the available regulatory framework for venturing
into and enhancing agricultural financing.
Healthy
growth improved the share of Islamic Consumer Finance
On the other hand, the share of Islamic consumer
financing in total financing has risen to 29.05 percent in CY18 from 27.23
percent in CY17. The overall growth in consumer financing has been 19.40
percent in CY18 compared to 20.62 percent in CY17 (Chart 3.2.3).
Despite this deceleration, Islamic consumer financing contributes to 38.43
percent in overall growth of consumer financing. Within this particular
segment, IBIs encompass 47.15 percent and 54.56 percent share in overall
auto and house financing, respectively. This growth has mainly resulted
from these modes being asset backed (Ijara for Auto finance and Diminishing
Musharaka for housing finance) and consumer preference for the Islamic mode
of consumer financing over the conventional financing.
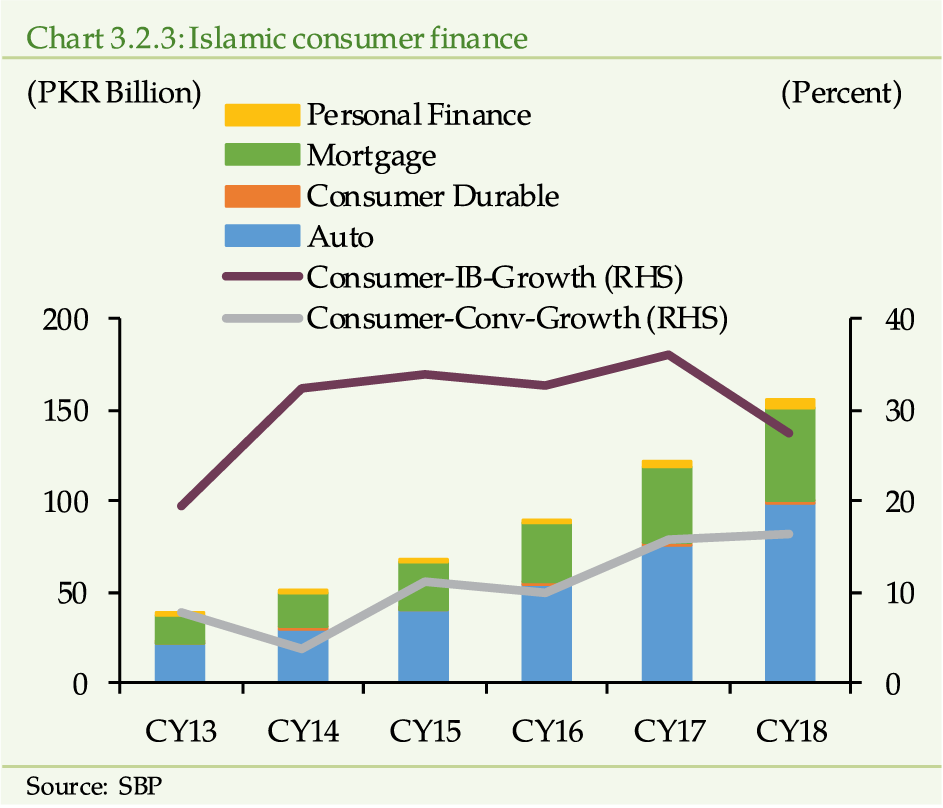
The asset quality of IBIs has improved,
suggesting lower credit risk
(Chart 3.2.4). The provision coverage is
at a comfortable level as it has increased to 83.20 percent in CY18 from
82.51 percent a year earlier. The improvement in the asset quality indicators
despite the increase in policy rate and macro-economic vulnerabilities indicates,
to some extent, better credit quality management at IBIs.
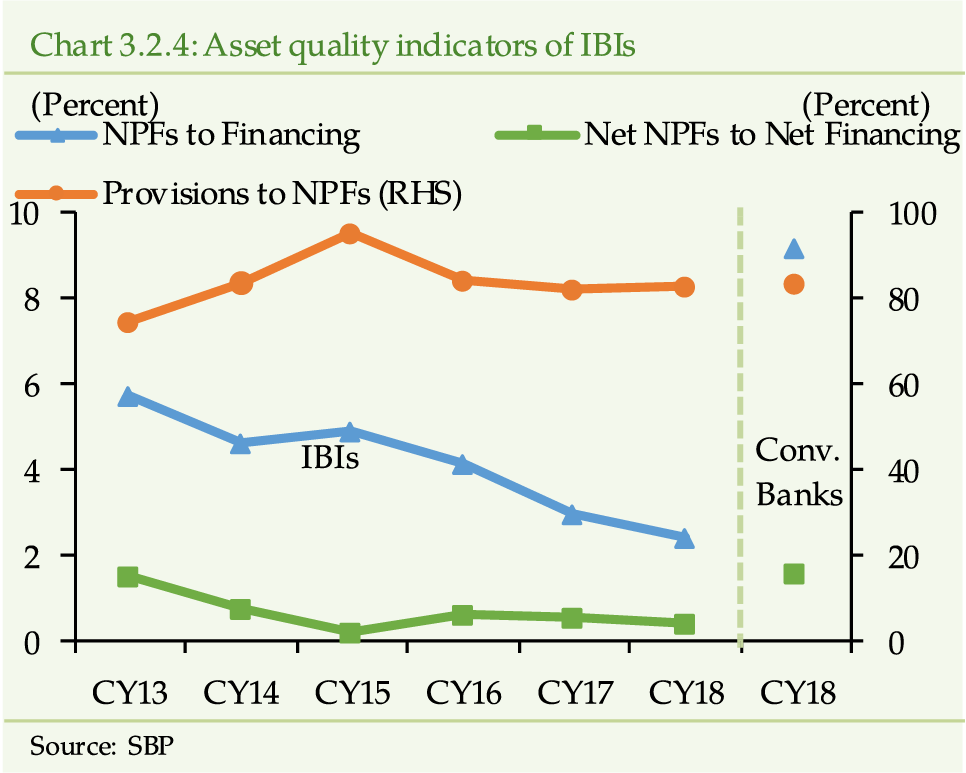
The dearth of Sharia compliant investment opportunities
routes IBIs focus towards financing
Due to dearth of Sharia compliant investment opportunities,
investment portfolio of IBIs has decreased by 3.35 percent in CY18 in contrast
to an increase of 9.14 percent in CY17. The share of investments in total
assets of IBIs is 19.37 percent, which is 43.46 percent in conventional
banks. This has nudged IBIs to expand their intermediation function through
higher financing leading to more profitability.
Further, analysis reveals that GoP Sukuk dominates the investment portfolio of IBIs with 59.71 percent share (Chart 3.2.5). Due to net maturity of GoP Sukuk, the share of corporate Sukuk in total investment portfolio has risen to 23.04 percent in CY18 from 19.58 percent in CY17.
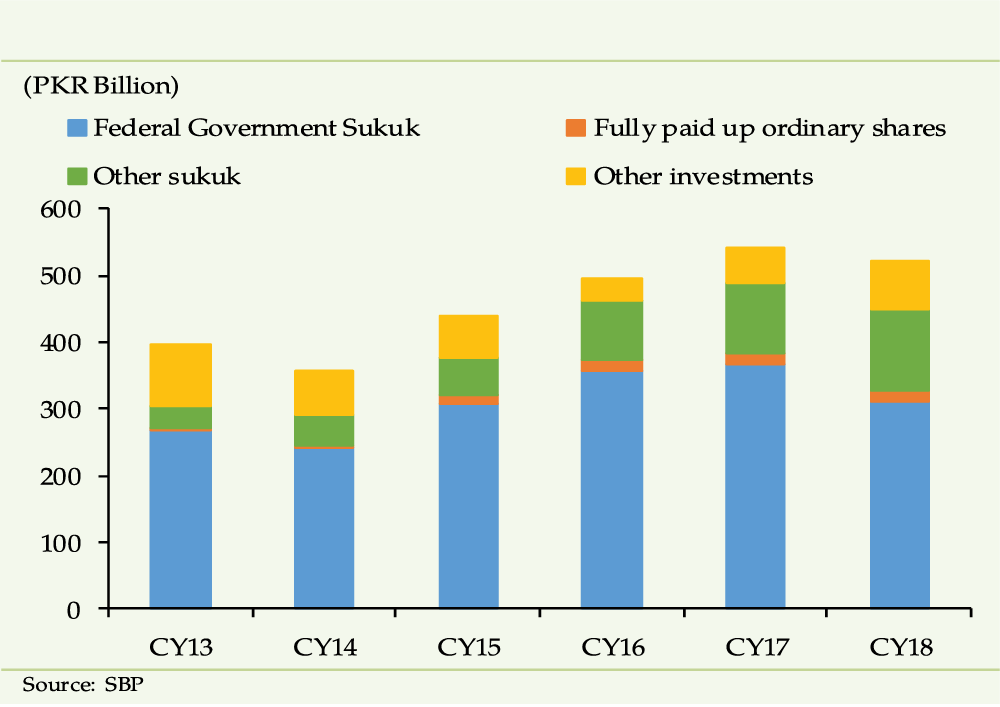
Deposits have provided needed funding
for asset expansion
Deposits are the mainstay of funding for the IBIs.
Though deposit growth has decelerated to 16.87 percent in CY18 compared
to 19.81 percent in CY17, they have funded 82.21 percent growth of total
assets during CY18. Both the savings and current deposits, have witnessed
deceleration in growth. Fixed deposits, on the other hand, have surged by
24.09 percent in CY18 compared to 10.41 percent in CY17 (Chart 3.2.6).
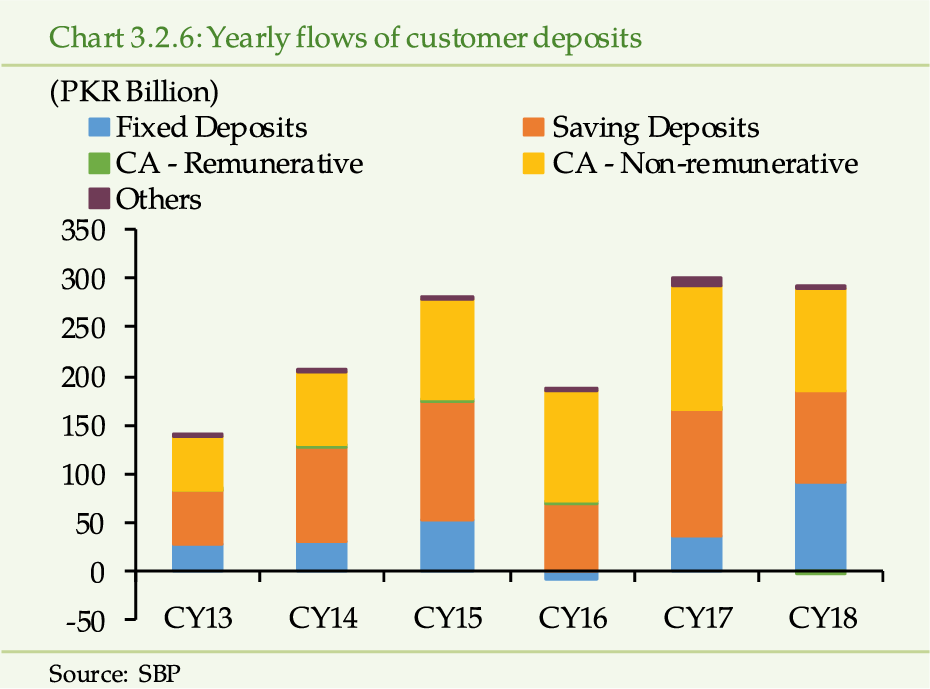
The growth in fixed deposits is quite substantial
as it accounts for 67.44 percent addition in total fixed deposits of all
banks. It seems that with growing financing to deposit ratio IBIs have a)
increased mobilization of fixed deposit, in an increasing interest rate
environment and at a relatively lower cost than the conventional banks
[6]
; and b)opted to mobilizing long-term deposits to improve their
maturity profile; IBIs have mostly mobilized deposits with maturity above
3 years. The latter aspects has helped IBIs in improving the overall maturity
gap due to improvement in financing flow and compositional change in the
deposit profile. (Chart 3.2.7).
 The scarcity of short-term investment instruments for deployment of funds
has remained a key issue for IBIs. Due to net maturities of GoP sukuk during
CY18, liquid assets have declined by 2.98 percent to PKR 596 billion. As
a result, liquid assets to total assets has seen considerable decline to
22.41 percent over a year. Further, IBIs have kept 27.83 percent of their
liquid assets in the form of cash, balances with other banks and lending
to financial institutions compared to 16.59 percent in case of conventional
banks (Chart 3.2.8). However, IBIs liquidity remain in a comfortable
zone as the Statutory Liquidity Requirement (SLR) for IBIs stands at 14
percent against the requirement of 19 percent for the conventional banks.
The scarcity of short-term investment instruments for deployment of funds
has remained a key issue for IBIs. Due to net maturities of GoP sukuk during
CY18, liquid assets have declined by 2.98 percent to PKR 596 billion. As
a result, liquid assets to total assets has seen considerable decline to
22.41 percent over a year. Further, IBIs have kept 27.83 percent of their
liquid assets in the form of cash, balances with other banks and lending
to financial institutions compared to 16.59 percent in case of conventional
banks (Chart 3.2.8). However, IBIs liquidity remain in a comfortable
zone as the Statutory Liquidity Requirement (SLR) for IBIs stands at 14
percent against the requirement of 19 percent for the conventional banks.
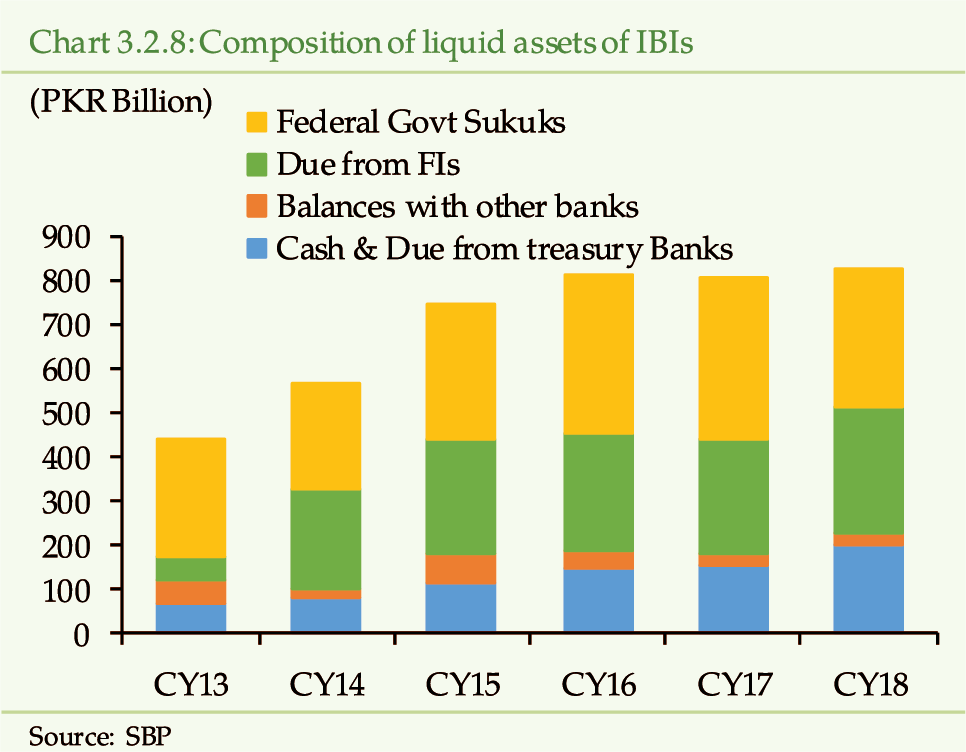
Low borrowings entail limited funding
risk
Contrary to conventional banks reliance on borrowings
(12.73 percent), IBIs have funded 6.23 percent of their total assets through
borrowing on average.
[7]
Lack of Shariah compliant instruments in interbank market also
restricts the borrowing of IBIs which may lead to funding risk in short-term.
As such, IBIs are more dependent on deposits to finance their assets.
Within the secured borrowing, Islamic export refinance
is 44.32 percent of the total borrowings. With the introduction of three
different Islamic financing facilities, for Modernization of SMEs, Storage
of Agricultural produce, Renewable energy, and financing facility for low
cost housing for special segments, it is
expected that these secured borrowing facilities from SBP might increase
Islamic financing in above focused areas in the future.
IBI
The profitability of the IBIs has improved significantly
over the year. The profit (after tax) at PKR 24.88 billion has registered
an increase of 51.31 percent in during CY18. (Chart 3.2.9). Resultantly,
the after-tax Return on Assets (ROA) has improved to 1.02 percent in CY18
from 0.81 percent in CY17.
Improvement in earning has, mainly, resulted from 29.95 percent increase
in net markup income during CY18. Analysis of the components shows that
most of this growth in net markup income has been contributed by 44.42 percent
rise in markup income from financing activity, while mark-up expense increased
by 35 percent.
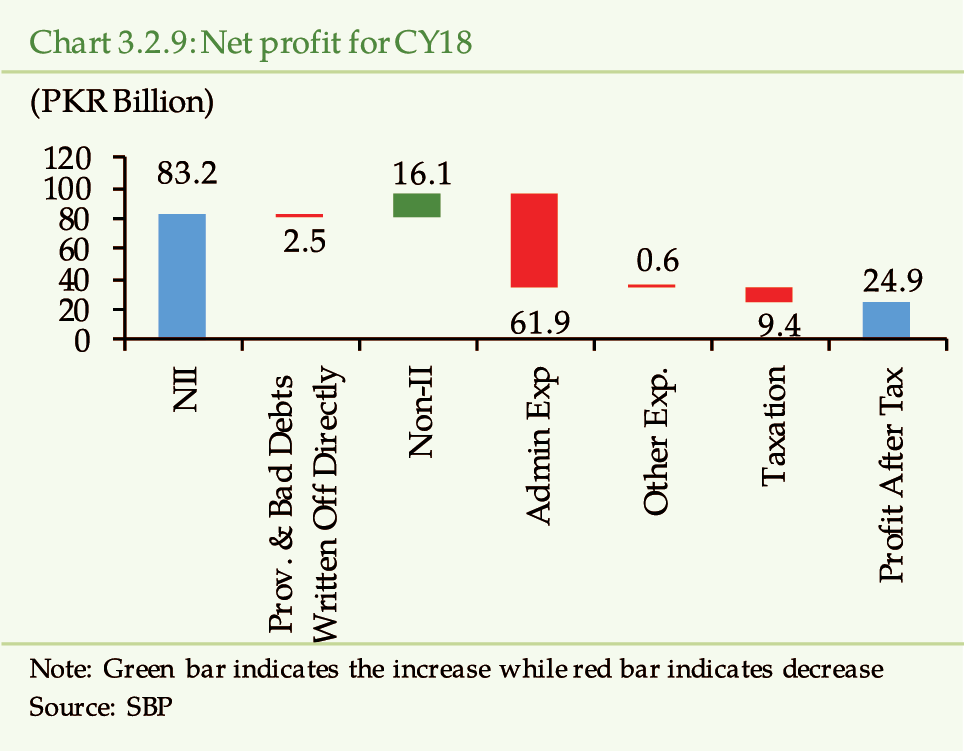
which strengthens the solvency profile
of IBIs
Driven by high profitability, the solvency of the
IBIs has strengthened. CAR has improved to 14.04 percent in CY18 from 13.06
percent inCY17 (Chart 3.2.10), which is well above the regulatory
requirement. The improvement can be attributed to increase in the unremitted
profit by PKR 17 billion (44.00 percent) in CY18 and dilution of CRWAs due
to increase in public sector financing. Despite some improvement, the CAR
of IBIs has remained below the conventional banks, primarily, due to high
share of financing in total assets.
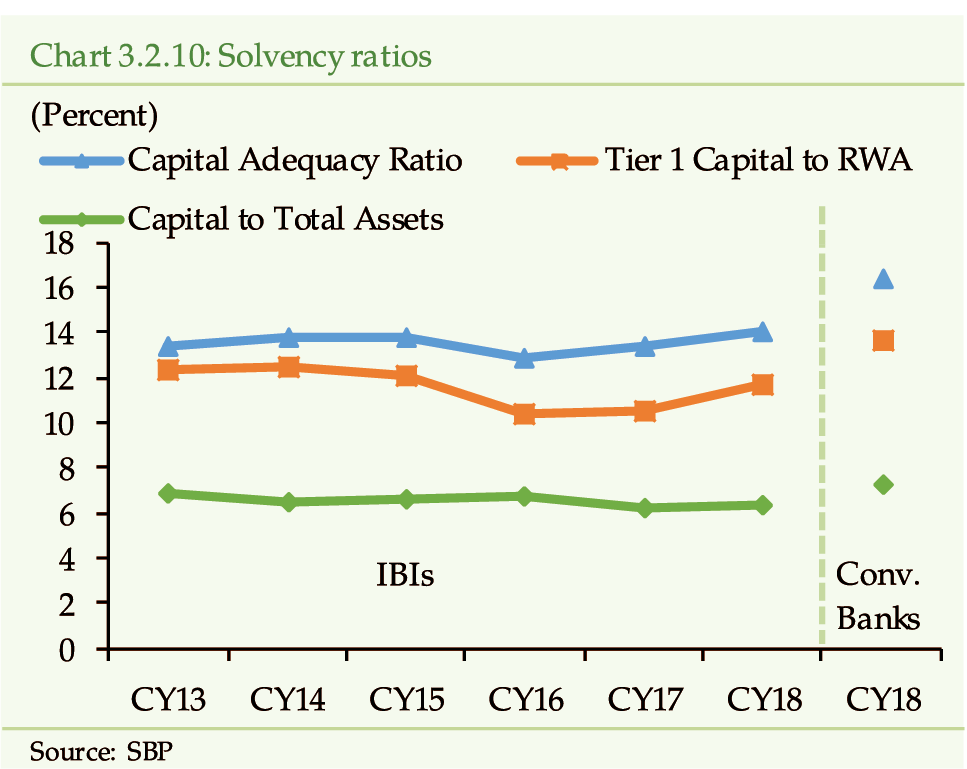
In addition to the risk confronted by the conventional
banks, IBIs are exposed to Shariah non-compliance risk arising from their
failure to comply with the Shariah standards. SBP, cognizant of this risk,
has put in place a detailed Sharia Governance Framework for IBIs.
[8]
In addition, it has advised IBIs to undertake enhanced
measures for training and capacity building of their staff.
[9]
The Islamic banking industry has continued its
impressive growth in CY18. Besides IBIs own efforts, the conducive operating
environment provided by SBP has also been an important factor. SBPs efforts
in promoting Islamic Banking in Pakistan have been recognized internationally.
It has been presented with a global award as the best Central Bank in promoting
Islamic finance for the year 2018. The award is conferred by the Islamic
Finance News (IFN), an arm of RED money Group, Malaysia.
The IBIs have showed interest in SME financing, which will give impetus to economic growth due to its strong economic interlinkages of SMEs. However, at the same time, it may increase the credit risk of IBIs if credit risk management is compromised. For further product diversification and enhancing contribution in the economic growth, IBIs needs to explore new business opportunities in the low cost housing and enhance financing to agriculture segment.
Islamic
Financial Services Board (IFSB), 2019. Islamic Financial Services Industry
Stability Report 2019. Available at: https://www.ifsb.org/download.php?id=5231&lang=English&pg=/sec03.php
[2]
Islamic Financial Services Board (2018). Islamic Financial
Services Industry Stability Report 2018. [online] Kuala Lumpur: Islamic
Financial Services Board. Available at: https://www.ifsb.org/download.php?id=4811&lang=English&pg=/sec03.php
[Accessed 27 Feb. 2019].
[3]
IFSB Key Exhibits available at: https://www.ifsb.org/psifi_02.php?selfolder=
[4]
Individual includes financing to consumer, sole proprietorships,
and any business owned by single individual, irrespective of the size of
its operations.
[5]
As per Policy for promotion of SME Finance, SBP assigned SME
financing targets to banks and DFIs for the first time in 2016 in order
to enhance access to credit to this sector. SBP is targeting SME financing
to reach 17 percent of total private sector credit by the end of 2020. Currently,
SME financing is at 6.2 percent of the total private sector credit. Therefore,
SME credit is expected to grow significantly in the years ahead.
[6]
SBP has issued Minimum Saving Rate (MSR) Policy for banks in
terms of which are required to remunerate the saving deposits at least at
50bps below the floor of the interest rate corridor. However, keeping in
view the Sharia Laws, SBP exempted IBIs to observe the Minimum Saving Rate
on deposits vide BPRD Circular No. 7 of 2008..
[7]
IBIs have funded, on an average, 6.23 percent of their
assets through borrowings in CY 18 compared to 5.35 percent of their assets
in CY17.
[8]
IBD Circular No. 01 of 2018 available at: http://www.sbp.org.pk/ibd/2018/C1.htm
[9]
IBD Circular No. 02 of 2018 available at: http://www.sbp.org.pk/ibd/2018/C2.htm
3.3 Resilience of the Banking Sector under Stress Scenarios
The stress scenario is not a forecast of macroeconomic
and financial conditions. It is a hypothetical but coherent tail-risk setting
designed specifically to assess the resilience of the banking sector to
potential deterioration in macroeconomic conditions. This years stress testing
exercise assesses the extent to which the banking sector is able to withstand
hypothetically designed domestic and global shocks in the medium term, besides
considering the business as usual conditions in the baseline. Given the
existing vulnerabilities, under the baseline scenario, the sectors current
level of solvency may deteriorate moderately yet it will remains well above
the domestic regulatory benchmark. Under the hypothetical shock scenarios,
however, the banking sector can withstand for three years the severe and
protracted downturn induced by adverse global macroeconomic conditions.
In terms of size, all categories of banks can withstand the stress conditions
as well. Reassuringly, the large size banks with potential to cause systemic
disruptions carry sufficiently higher capital buffers and are able to sustain
the impact of hypothesized shocks for around four years. The resilience
of medium sized banks, however, may come under stress after three years,
while small size banks continue to meet solvency criteria during the projection
horizon of five years. Encouragingly, the banking system with adequate capital
buffers can cater to the credit needs of the economy even during stress
periods, albeit at a slower pace.
3.3.1 Background and Developments
The feedback effects between the real and financial
sectors, where vulnerabilities in one sector spillover to the other, have
been most prominently highlighted by the onset of global financial crises
(GFC) of 2007-08. Since then, the regulators and supervisors have enhanced
the level of financial sector oversight, thereby emphasizing on its resilience
to withstand shocks transmitting from the rest of the economy. At the same
time, stress-testing framework is also being extensively used by the domestic
authorities as well as multilateral agencies to assess the resilience of
the banking sector to certain hypothetically designed adverse yet plausible
event(s). The results of stress-tests, therefore, depict the projected behavior of macro-financial variables
and health of the banking sector under the assumed scenarios.
The SBP has been conducting this exercise internally
on a quarterly basis since 2005 while for the external stakeholders, the
stress-testing results are being published in the FSRs since 2007-08. The
stress-testing framework, while still in its evolutionary phase, is continuously
being revamped and strengthened over the recent years.
The current years stress testing exercise includes
three separate scenarios, designed
to assess the health of the banking sector over the medium term, i.e. five
years from Q1CY19 to Q4CY23.
The baseline scenario traces the path of macro-financial variables under
the current dynamics of the domestic macro-economy, i.e., business as usual.
The other two scenarios, domestic
and global, on the other hand, assume crystallization
of idiosyncratic and systemic shocks, such as natural disasters and disruptions
in global economy, and project their impact on the resilience of the banking
sector. Of the latter two stress scenarios, global has been designed
to be severer.
[1]
The methodology used to evaluate the resilience
of banking sector in all the three scenarios is similar but differs in terms
of paths being followed by the macroeconomic variables. Given the interaction
between various sectors of the economy, a number of variants of vector autoregressive
(VAR) models have been employed.
[2]
,
[3]
In addition, the cross-sectional heterogeneity has been
captured by including segments of banking industry in terms of size (i.e.,
small, medium, large).
3.3.2 Scenario Design Overview
The baseline scenario assumes business as usual environment, both globally
and domestically, and is based on recent macroeconomic developments. The
domestic scenario has been constructed
to assess vulnerability of the banking sector to risks emanating from agrarian
nature of domestic economy. These risks include catastrophic events generally
attributed to climate change and, disruption in river flows due to rising
geopolitical tensions. The global
scenario focuses upon implications of slowdown in key trading partner
economies, down grading by Financial Action Task Force (FATF), volatile
oil prices and stabilization measures taken post- anticipated IMF program.
The implications of changes in macroeconomic indicators;
such as output, inflation, exchange rate, interest rate and exports, on
the health of the banking sector have been captured via non-performing loans,
profitability and solvency. Specifically, the economic downturns can negatively
influence the income levels of borrowers and affect their debt servicing
capacity, thereby amplifying the credit risk for banks. This in turn would
put adverse pressures on the profitability of banks, thus negatively affecting
their solvency.
Given the feedbacks, the solvency issues in banking
sector could spill over to the real economy as the banks would be reluctant
to provide credit to even potentially profitable investment opportunities,
amplifying the downturn. The sharp deceleration in credit flows by the banks
during the downturns, could further slowdown the pace of economic growth.
Stress test models, designed to test banking industrys
resilience against adverse shocks, capture these inter-linkages among the
various sectors of the macro economy. The monetary authoritys feedback
reactions, in response to the shocks, are assumed to reflect in the interest
rate adjustments.
In terms of risk coverage, the resilience of the
banking sector has been assessed against credit, market (interest rate and
exchange rate) and operational risks.
Baseline Scenario
The baseline scenario, Scenario 0, assumes absence of any idiosyncratic
or systemic shocks over the simulation period. However, in 2018, domestic
economy has experienced rise in inflation and downward adjustment in value
of currency;
[4]
primarily owing to challenges on fiscal and external accounts.
Policy makers have countered this situation by contractionary monetary and
fiscal policies.
[5]
Owing to these stabilization measures, uncertainties surround
the short run growth prospects. Considering these developments, international
observers, e.g., IMF, are also expecting lower growth trajectory (Chart 3.3.1).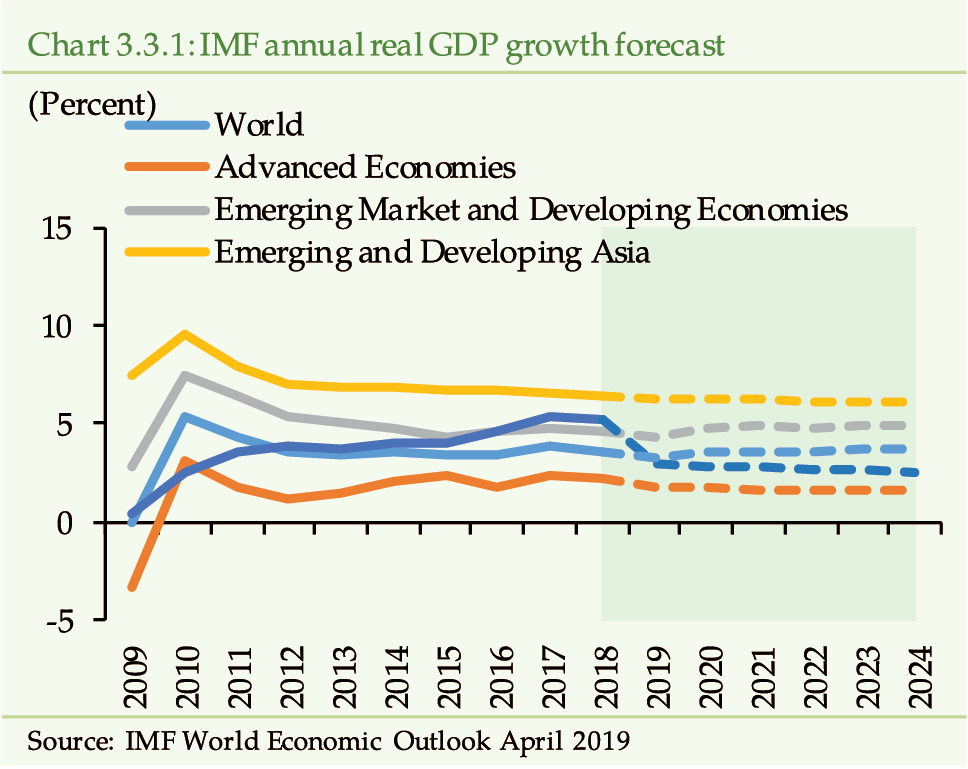 [6]
[6]
In the medium run, adoption of contractionary monetary
and fiscal policies is expected to tame inflationary pressure; albeit at
the cost of economic activity. On the other hand, adjustment in exchange
rate is expected to support current account deficit by rationalizing imports
demand and boosting exports. So far as the oil prices are concerned, Scenario
0, assumes prices to remain in the range of USD 55-60 per barrel; which
is consistent with medium term projections based on oil futures.
[7]
Domestic Scenario
The agriculture sector remains one of the important
component of domestic economy. Though its share is slowly declining, the
sectors output accounts for around one-fifth of the total GDP. Further,
its interlinkages with industry and services sectors make it an important
driver of the economic growth. Naturally, the sector remains prone to climate
change and natural calamities such as periodic floods and droughts. Such
shocks, in the past, have led to periods of low growth, surging inflation
and reduced productive capacity in the economy.
Global warming and the consequent climate change
have been postulated to lead to extreme weather conditions causing droughts,
floods, famine and cyclones. According to Long-Term Climate Risk Index (CRI)
2019, during last two decades, Pakistan experienced 145 climate related
events and remains 8th most affected country in terms of human
and output losses.
The domestic stress scenario, Scenario 1, of the current exercise is
largely similar to the previous years design, as discussed earlier. However,
some adjustments have been made so that the scenario remains relevant and
plausible. It considers the effects of climate change, particularly water
shortage, on the agriculture sector, overall economy and ultimately the
banking sector. The less availability of water is assumed to mainly stem
from reduced rainfall, lower river flows,
[8]
less snowfall and depletion of glaciers due to extreme temperatures.
Additionally, the scenario is also motivated by the recently escalated geopolitical
tensions and potential threats of water blockage. Such climate change and
geopolitical risks may raise concerns about water conditions and its availability
in the medium term.
In this context, the basis of shock design stands
on the footprints of 1999-2001 drought, one of the longest and worst episodes
of droughts (Chart 3.3.2).
[9]
A substantial fall in agriculture output, mainly due to crops
failure, is therefore assumed and the domestic economic growth contracts
to 2 percent for initial two years and recovers to around 3 percent by the
end of the scenario.
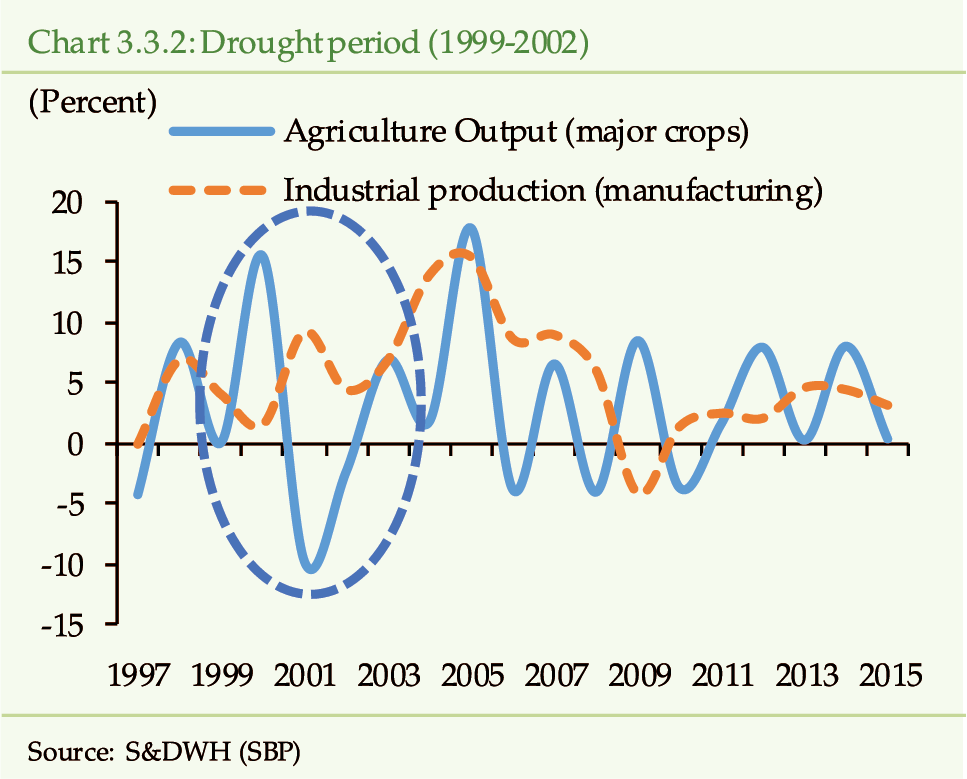
The assumed crop failure may prompt the government
to provide post-disaster relief packages, pushing current expenditure up
and worsening the fiscal position.
With a drop in agriculture output, it is assumed
that agri-exports, which constitute around 17 percent of total exports in
December 2018, would fall.
[10]
Non-agriculture exports, which use agriculture produce as raw
materials, would also be hampered. Overall, the exports would decline before
rising back by the end of scenario. The imports of raw materials and food
could also rise, which in turn would further aggravate countrys current
account balance.
The PKR/USD parity may also weaken, leading to
cost-push inflationary pressures. Given low domestic savings - lowest among
peer countries - the severity of the shock may amplify.
[11]
The expected water shortages could also weigh significantly
on the hydropower generation, which, during Jul-Feb FY18, constituted around
27 percent of total electricity generation.
[12]
The stressed energy conditions may depress the industrial production
and domestic investments, causing a drop in overall output. The supply shock
may further intensify the price pressures as well.
To meet the shortfall, among other alternatives,
thermal sources of power generation is expected to be pushed further. However,
such a remedy may lead to higher import of oil and coal, thus amplifying
the already high import bill. Besides pressures on the external account,
the situation would result in higher prices, mainly via pass-through to
consumer goods. Headline inflation is, thus expected to reach as high as
14 percent before falling back to 8 percent during the projection horizon.
In response to these vulnerabilities, appropriate adjustments in interest
rates is also presumed to check inflationary expectations.
The growth paths considered in this scenario for
various macro-financial variables are projected through the same feedback
models used in Scenario 0.
Global Scenario
This years global scenario incorporates four key
global risks. These risks include the decline in world economic growth,
escalations of trade tensions among major economies, volatile oil prices
and potential downgrading of Pakistan from grey-list by FATF. The scenario
(Scenario 2), designed to assess the capability of the domestic banking
sector to withstand simultaneous materialization of the above mentioned
downside risks, portrays a considerably extreme but plausible set of events.
The IMF, in its latest issue of WEO April 2019,
estimates Pakistan economy to grow by 2.9, 2.8 and 2.5 percent in 2019,
2020 and 2021, respectively. While, it estimates the world GDP growth for
2018 to slightly taper and tick in at 3.6 percent.
[13]
Moreover, forecasts of world GDP growth for 2019 and 2020 are
revised downward by 40 and 10 basis points to 3.3 and 3.6 percent, respectively.
One of the key factors behind slowdown of global growth is US-China trade
tensions. Scenario 2 assumes intensification of these trade tensions,
which may detract ongoing recovery of global financial markets.
Apart from general recessionary impact of trade
tensions, downsides include uncertainty regarding no-deal Brexit in UK,
geopolitical tensions in Middle East and larger than anticipated slowdown
in these economies. If materialized, these risks may negatively affect exports
and remittances related flows to Pakistan economy.
[14]
International observers are foreseeing oil prices
to stay around USD 55 per barrel in the medium run.
[15]
Despite this stable and low outlook for oil prices, risk of resurgence
in prices exists and explains the recent rise in oil prices.
[16]
For instance, OPEC member countries and Russia have been trying
to cut oil production in response to prolonged low oil prices, which are
not viable for most of the oil producing countries.
[17]
Further, the effective materialization of US imposed sanctions
on oil exports from Iran might beget the rise in oil prices at a higher
pace.
[18]
Accordingly, Scenario 2 assumes oil prices to reach USD
80 per barrel before stabilizing at USD 75 per barrel during the last year
of projection period.
Under Scenario 2, the above global risk
factors will accentuate the domestic economic vulnerabilities, especially
the twin deficits. Keeping in view the above facts, our global scenario
also assumes that the fiscal and BoP vulnerabilities would necessitate support
from IMF. However, IMF programs typically accompany macroeconomic consolidation
measures, including a floor on net foreign assets (NFA) and a ceiling on
net domestic assets (NDA). As a result, exchange rate depreciation and upward
adjustment in utility prices may be anticipated. Further, with a ceiling
on NDA in place, the government generally turns towards scheduled banks
to finance budget deficit, which may crowd out private sector investment
during initial phase of macroeconomic consolidation. However, as the consolidation
efforts bear fruits and economy stabilizes, fundamentals are likely to improve,
albeit gradually, during the second half of our projection period.
Amid these anticipated developments and recovery,
this scenario design assumes a U-shaped trajectory, with a sharp initial
deterioration, followed by gradual recovery towards end of the projection
period.
In line with global dynamics, Scenario 2
assumes that real GDP growth may decline to below one percent; leading to
significant slowdown in exports and remittances. Resulting pressure on external
account is expected to weaken PKR/USD parity; causing imports to be more
expensive and resulting in buildup of significant domestic price pressures.
In view of the assumed inflationary and exchange
rate pressures, an appropriate policy response may be required. Particularly
monetary authority may appropriately adjust the benchmark interest rates.
Therefore, the assumed external sector pressures, a slowdown of aggregate
demand and tighter monetary conditions, would translate into elevated levels
of credit risk, leading to higher infections and some brake on bank lending.
The slowdown in lending activity may also hurt the interest income of banks.
This, coupled with higher provisioning expenses, could possibly impair banking
industrys profitability and ultimately the capital adequacy.
3.3.3 Stress Testing Results: System Level
(a)
Impact on Credit Riskiness
The results of stress test exercise indicate that
gross non-performing loans ratio (GNPLR), under Scenario 0, is likely to remain somewhat
elevated over the five year projection horizon, given the domestic and external
pressures (Chart 3.3.6). Over the initial two years
of projection horizon, GNPLR may rise to 11.54 percent and would settle
at the level of 13.07 percent by the end of projection period, which is
5.16 percentage points higher than 7.91 percent as of end 2018. This is
mainly in line with our assessment of the domestic economy, where existing
macro-economic vulnerabilities may cause a moderate level surge in NPLs
of the banking sector.
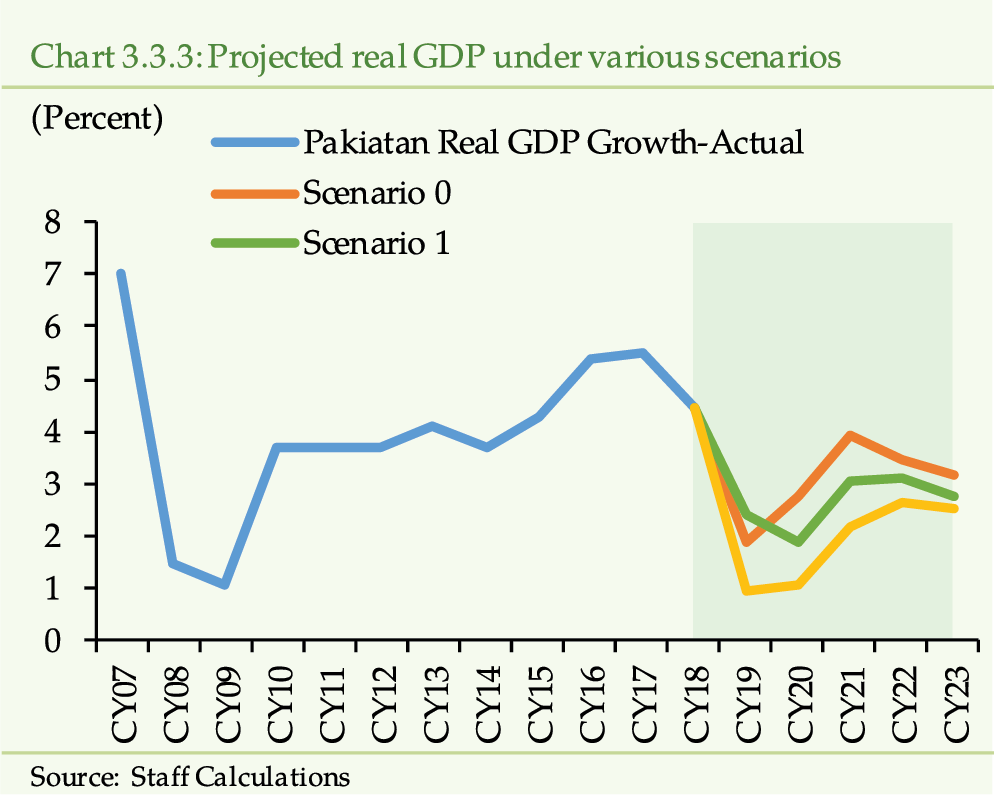
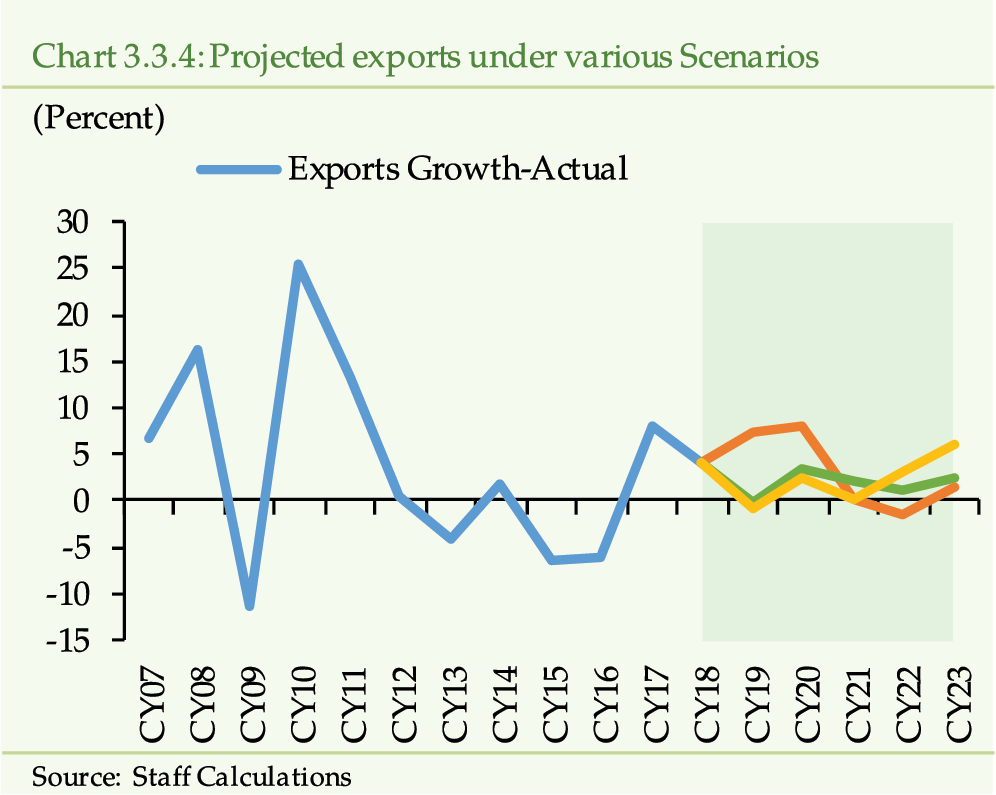
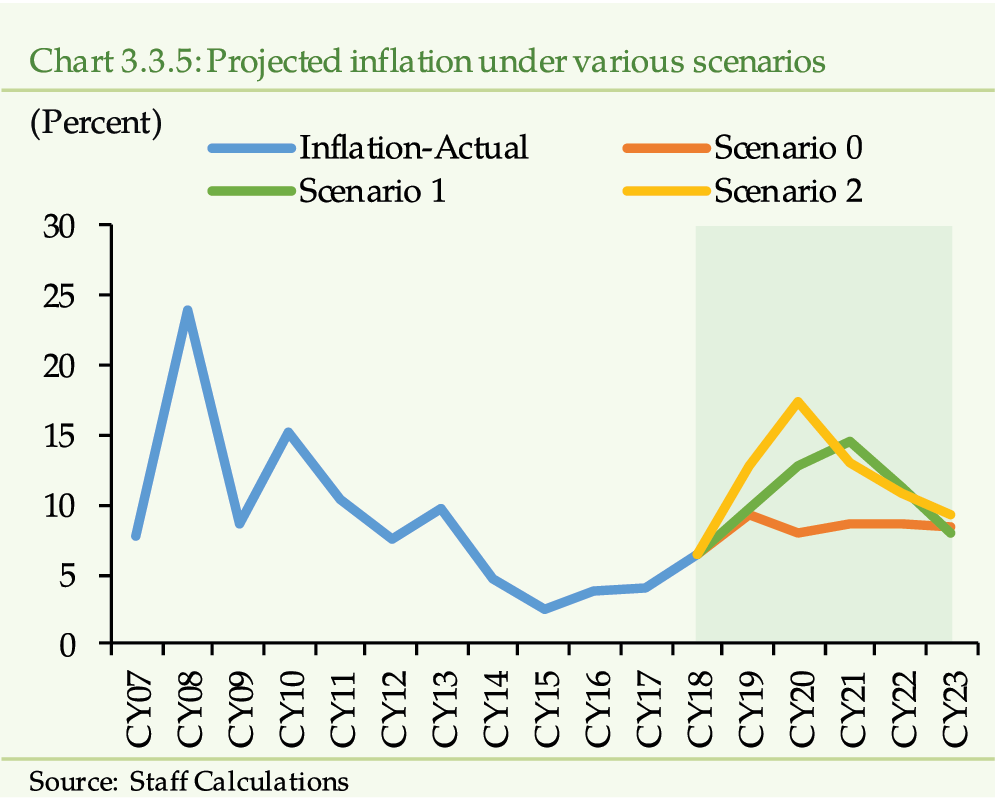
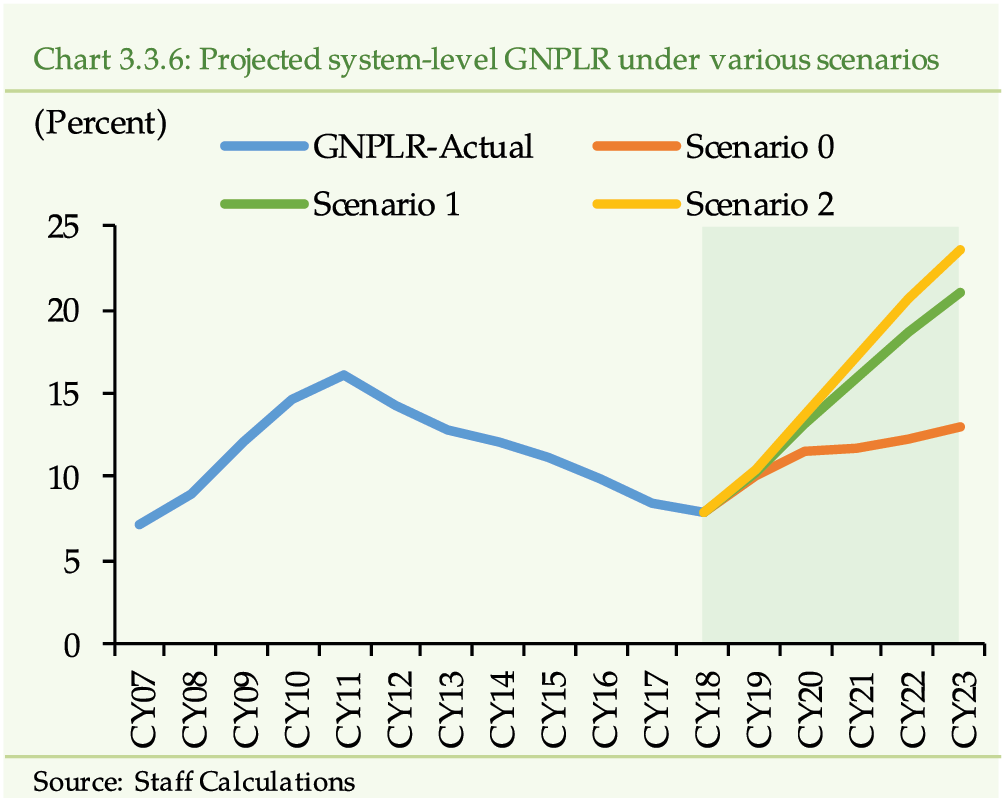
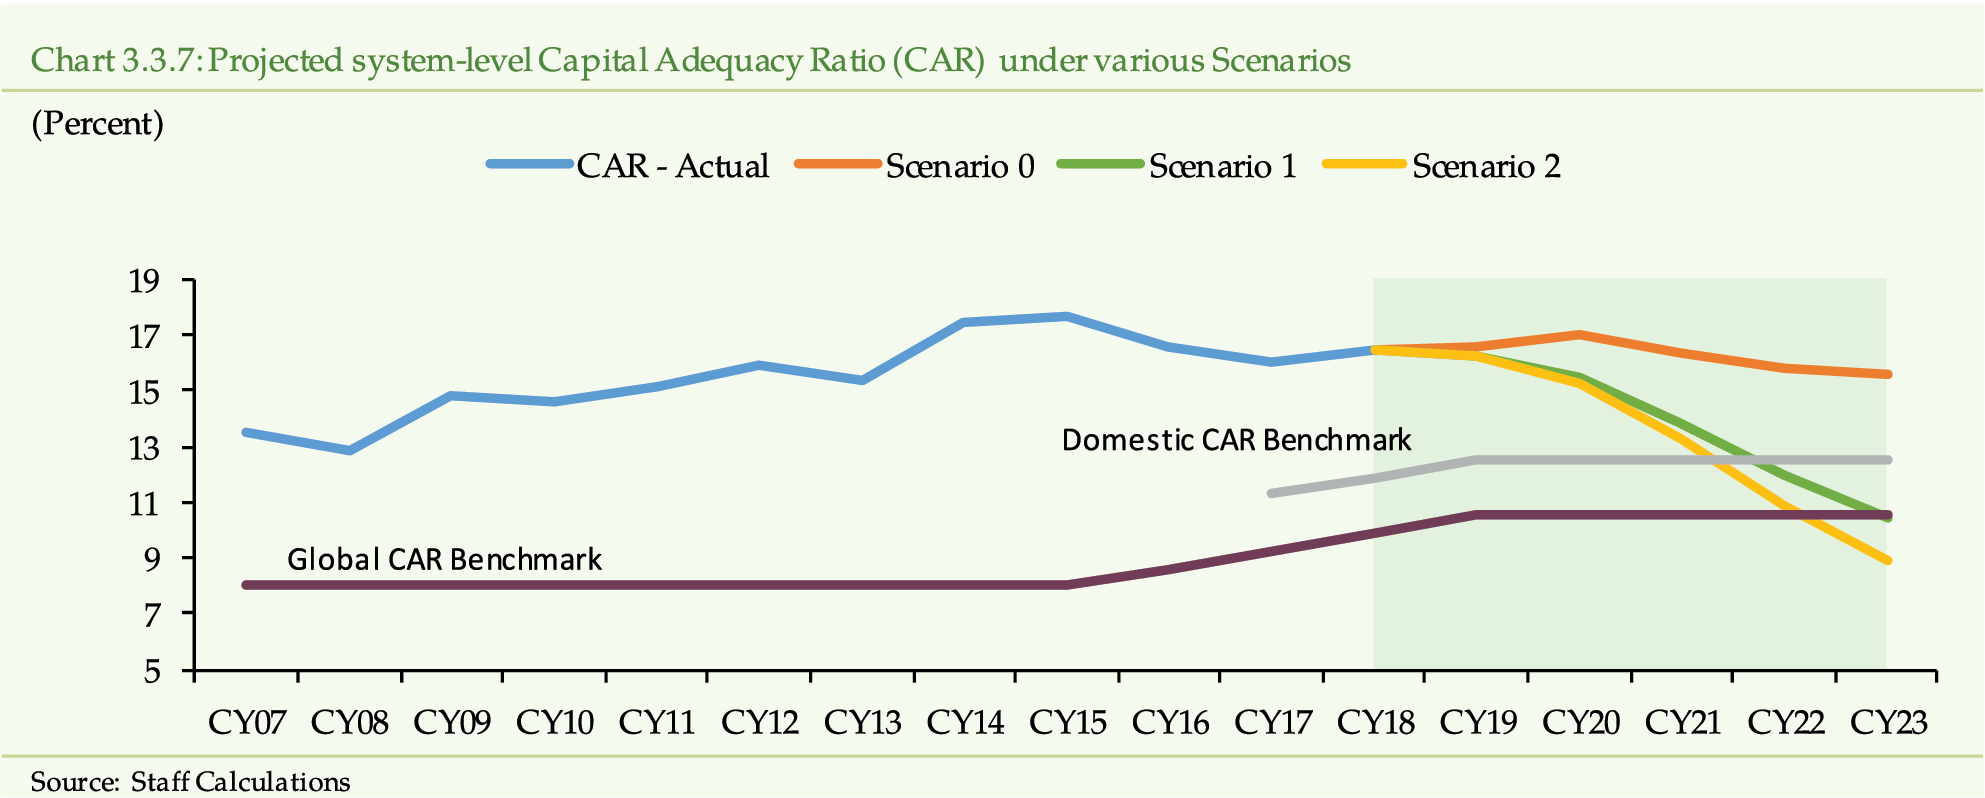
Scenario 2) as delinquency rate touches 23.64
percent by the end of projection horizon. In response to domestic shocks
(Scenario 1), on the other hand,
delinquency reaches to 21.10 percent. Credit risk under both stress scenarios
are higher than the GNPLR levels observed during last 15 years. The assumed
crisis under global shocks might pose stability concerns to the banking
system.
Likewise, domestic led vulnerabilities also threaten
banking sector stability but to a slightly lesser extent. The assumed faster
recovery under domestic scenario by the end of projection period could be
the reason behind lesser severity of GNPLR levels under Scenario 1
compared with Scenario 2.
(a)
Impact on Solvency
The impact on solvency is measured via Capital
Adequacy Ratio (CAR) of the banking system. As expounded in the scenario
design, besides the credit risk, other risks viz., the market
risk, realized via movements in interest and exchange rates, as well
as the operational risk are likely to have impact on solvency. These
risks, therefore, have been factored in while analyzing the impact of each
scenario on eligible capital as well as risk weighted assets. Under the
business as usual environment, the CAR of the banking system moderately
deteriorates by 0.86 percentage points by the end of projection period.
This is mainly on the back of existing macroeconomic risks discussed earlier.
The CAR, under scenario 1 and 2, falls to 10.45 percent and 8.94 percent,
respectively.
More specifically, under Scenario 1 (Domestic
Shock), the banking industry breaches domestic regulatory benchmark in fourth
year while it falls below the international regulatory benchmark (10.5 percent)
in the last year of the projection horizon. (Chart
3.3.7).
[19]
The banking sectors CAR significantly declines in the event
of a global shock. In this case, the industry breaches domestic and international
CAR benchmarks, respectively, in the third and fourth years of projections
horizon. It is important to highlight that the domestic CAR requirements
are set at levels higher than the global standards.
3.3.4 Stress Testing Results Segment
Level
In line with the system-level default analysis,
segment level (small, medium, large) infection ratio has also been projected.
This aspect of banking industry is included to assess how the cross-sectional
heterogeneity affects the resilience of banks against various macroeconomic
risks.
For GNPLR, system-level projections of NPLs and
gross loans are distributed proportionately based on the contribution of
each segment in the loan portfolio of entire banking system as of end 2018.
Similarly, capital is also distributed proportionately to compute segment
level CAR.
Large
Banks
By the end of simulation horizon, large banks witness a rise of 4.63, 11.83 and 14.11 percentage points in GNPLR and a fall of 0.94, 4.45 and 5.45 percentage points in CAR, under scenarios 0, 1 and 2, respectively. Scenario 2 turns out to be the most severe and deteriorates profitability of large banks the most (Chart 3.3.8 (a & b)).
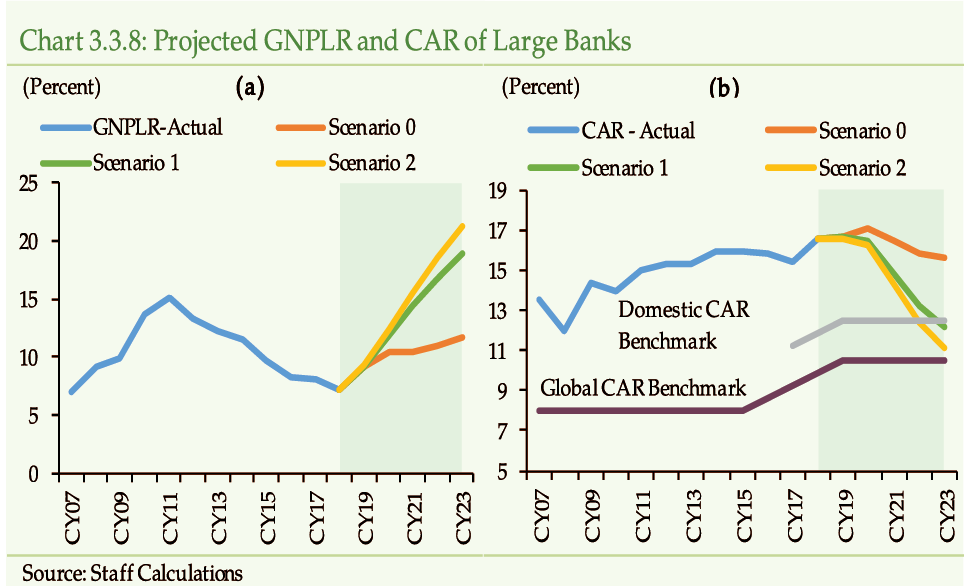
Scenario 2 and CY23 in case of Scenario
1 (Chart 3.3.8 (b)). This implies that the large banks can generally
withstand the stress for three years. Reassuringly, the minimum global benchmark,
however, would not be violated in any stress scenario over the projection
period. Sufficiently higher capital buffers available with larger banks
would help them withstand even the severe shocks. More importantly, the
systemically important banks remain well capitalized and resilient to support
real economic growth even in times of stress, although some deceleration
in the extension of loans could be observed.
Medium
Banks
By the end of projection period, GNPLR of medium-size banks rises in scenarios 1 and 2 by 6.47, 16.52 and 19.70 percentage points, respectively, while the CAR falls by 0.46, 5.61 and 7.47 percentage points. Again, the adverse impact of shocks emanating under global scenario outweighs the consequences of domestic scenario in terms of severity (& b)).
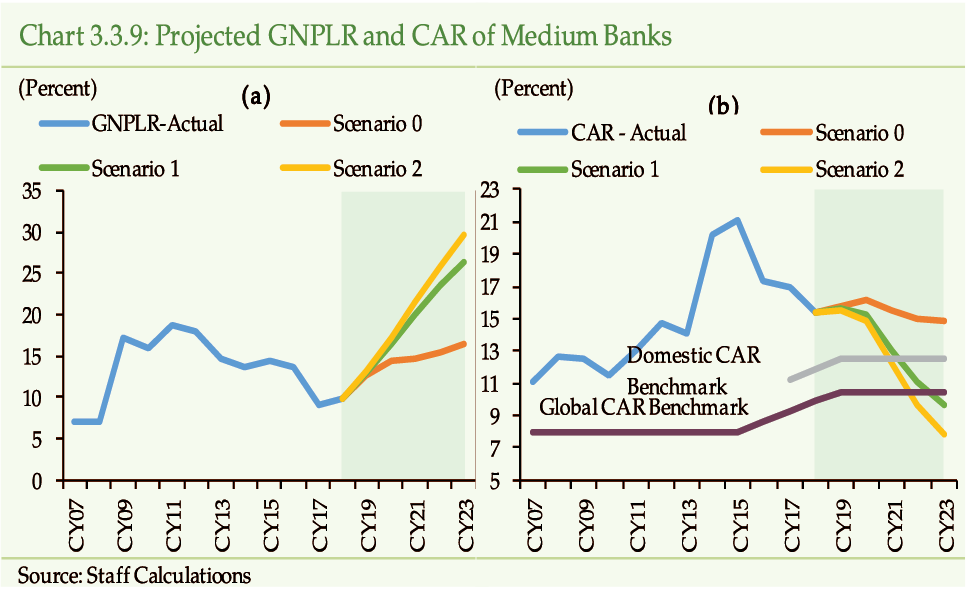
In case of domestic shocks, Scenario 1, this segment of industry
breaches local and global CAR standards in CY22 and CY23, respectively.
In case of global shocks, Scenario 2, medium sized banks breach local
and global CAR standards in CY21 and CY22, respectively. (Chart 3.3.9(b)). Comparatively higher
levels of delinquency ratios and lower level of pre-shock capital buffers
possibly make medium banks more vulnerable to shocks.
Small
Banks
Small banks are found to be the most resilient against domestic and global shocks. Although, their CAR does fall like large and medium size banks yet, it remains well above both the local and global minimum capital requirements (Chart 3.3.10 (a & b)).
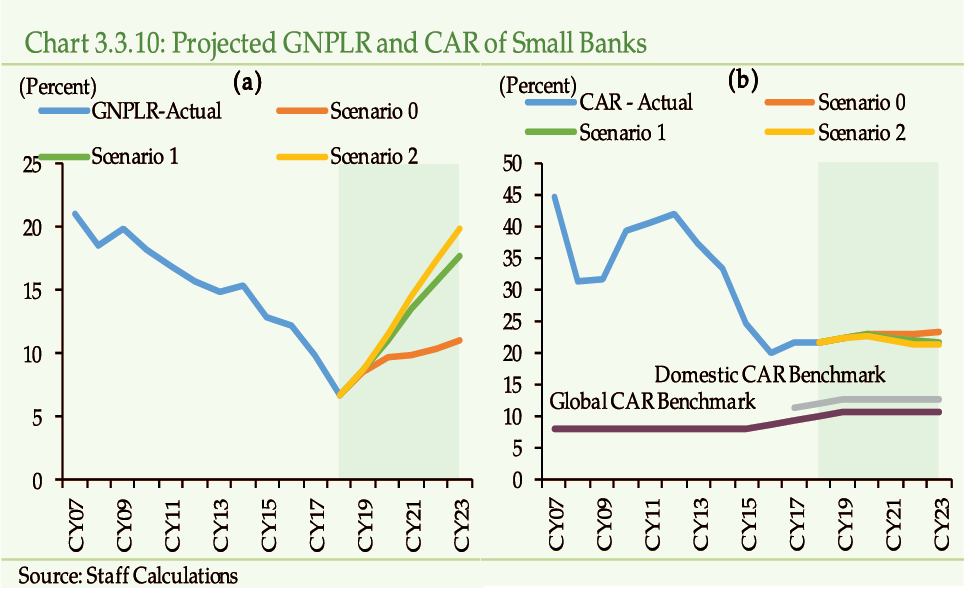
The loan delinquency rate of small banks rises by 4.36, 11.13 and 13.27
percentage points under scenario 0, 1 and 2, by the
end of five-year horizon (Chart 3.3.10
(b)), which happens to be the lowest among all three categories. Given
the lower exposure, comparatively, in terms of loans, the CAR of small banks
rises by 1.16 percentage points in Scenario 0 and by 0.03 percentage
points in Scenario 1; however, it falls 0.50 percentage points in
Scenario 2. Nonetheless, due to a comfortable pre-shock capital position,
small banks demonstrate enough resilience to maintain compliance with domestic
and global minimum capital requirements despite credit losses.
Overall, under the baseline scenario, the solvency of banking sector could experience some moderation; however, it remains well above the domestic regulatory capital benchmark. Under hypothetical shock scenarios, nonetheless, the banking sector can withstand some severe and protracted downturn induced by adverse global macroeconomic conditions for three years. In terms of size, all segments of banks including the small, medium and large, can withstand the stress conditions as well. Reassuringly, the large size banks with potential to cause systemic disruptions carry sufficiently higher capital buffers and are thus able to sustain the impact of hypothesized shocks for around four years. The resilience of medium sized banks, however, starts waning after three years, while small size banks never breach the solvency criteria during the projection horizon of five years
[1]
Usually three types of shocks are considered in stress testing
based on the length of the shock events i.e. V-shaped, L-shaped and U-shaped.
The shapes are envisaged in terms of recovery. V-shaped assumes quick recovery;
L-shape assumes protracted downturn while U-shaped assumes recovery towards
the end of projection horizon. Under this terminology, domestic scenario
is assumed to be V-shaped, while global as U-shaped. The recovery under
the domestic shock takes place earlier while economy takes a little longer
to recover under global shock.
[2]
For details, please see Box 4.1 Technical Details of Chapter
4: Resilience of the Banking Sector, Financial Stability Review 2016, SBP.
[3]
As per BIS study, one fifth of the authorities use VARs. [Bank
for International Settlements. Supervisory and Bank Stress Testing: A Range
of Practices. December 2017].
[4]
CPI and PKR-USD exchange rate increased by 6.5 and 26 percent
during CY 2018, respectively.
[5]
Policy rate was raised by4.25 percent in CY2018 while development
expenditures were cut by 37.2 percent during 2nd half of CY2018.
[6]
IMF World Economic Outlook, April 2019
[7]
IMF World Economic Outlook, April 2019
[8]
River flows constitute, on average, 75 percent of total water
supply in the country. SBP Annual Report on State of Pakistans Economy,
2016-17.
[9]
Pakistan Meteorological Department (2018). Drought Bulletin of
Pakistan, October-December.
[10]
Statistics and Data Warehouse Department, SBP.
[11]
Gross Domestic Savings (as percent of GDP in 2017): Pakistan
(6.8 percent), Bangladesh (25.3 percent), India (29.8 percent), Bhutan (25.2
percent), Vietnam (25.5 percent), Malaysia (32.5 percent) and Iran (44.3
percent). Source: World Bank.
[12]
Pakistan Economic Survey 2017-18, Ministry of Finance
[13]
IMF World Economic Outlook, April 2019.
[14]
UK and China are 2nd and 3rd major export destinations for Pakistan.
For FY2018, remittances from Middle East economies constitute 57 percent
of total remittances in Pakistan.
[15]
World Economic Outlook, April 2019, IMF.
[16]
A rise of USD 12 per barrel is observed in Dubai crude oil price
during Jan-Apr 2019.
[17]
https://www.bloomberg.com/graphics/opec-production-targets/
[18] Eight countries; including China, India, Italy, Greece, Japan, South Korea, Taiwan and Turkey; were granted exemptions expiring May 2, 2019. https://www.state.gov/secretary/remarks
https://www.reuters.com/article/us-usa-iran-sanctions-waivers/
us-grants-temporary-iran-oil-waivers-to-eight-
countries-including-china-pompeo-idUSKCN1NA1OS
[19]
The domestic CAR benchmarks are 11.90 percent (December 2018)
and 12.5 percent (December 2019 onwards).
4.1 Performance &
Risk Analysis of Development Finance Institutions (DFIs)
The participation in long-term
project financing, the core function of DFIs, has remained limited during
CY18. Lack of availability of affordable long-term liquidity remains one
of the key hurdles for DFIs. Encouragingly, DFIs, have renewed their interest
in SME financing, which is beneficial for the economic and financial development
of the country. To play their due role, DFIs need to make concerted efforts
for resource mobilization and explore the possibilities of arranging funds
through other sources, necessary enhancing suit of their asset product and
effectively contributing in the economic development of the country.
DFIs, in the 60s, have contributed significantly
in channelizing funds to the private sector (See Box-4: Brief history
of DFIs in Pakistan). However, during the past few decades, the performance
of DFIs has remained sub-par and their importance in the financial sector
has diminished.
The
share of DFIs in total assets of the banking sector is minimal...
The total assets of DFIs amounting to PKR 238 billion
represent only 0.92 percent of financial sector assets (1.21 percent of
the total banking sectors assets) (Table 4.1.1).
[1]
The expansion of asset base of DFIs by 4.60 percent
during CY18 is less than the growth of 7.31 percent achieved by the banks.
This low growth is despite the fact that a new DFI has commenced operations,
which contributed to the expansion in assets by 1.61 percent.
[2]
Thus, DFIs, due to their small size, pose limited systemic risk
concerns.
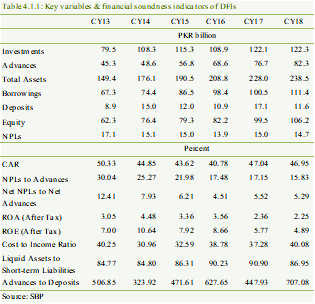
DFIs
show signs of risk taking
The asset composition of DFIs, still, remains tilted
toward investments. Total assets of the DFIs constitute 51.27 percent investments
and 34.53 percent advances indicating risk averse behavior. However, there
are indications that the DFIs might be taking more risk. During CY18, the
DFIs have increased their lending to SMEs, invested in commercial paper
and reduced their stock of government bonds. However, the risk taking ability
of DFIs is constrained by the non-availability of long-term funds. The DFIs
are mainly dependent on short-term borrowing from the interbank market to
finance their asset growth (Chart 4.1.1). Funding constraint is also
limiting their ability to extend long-term project financingtheir core
business.
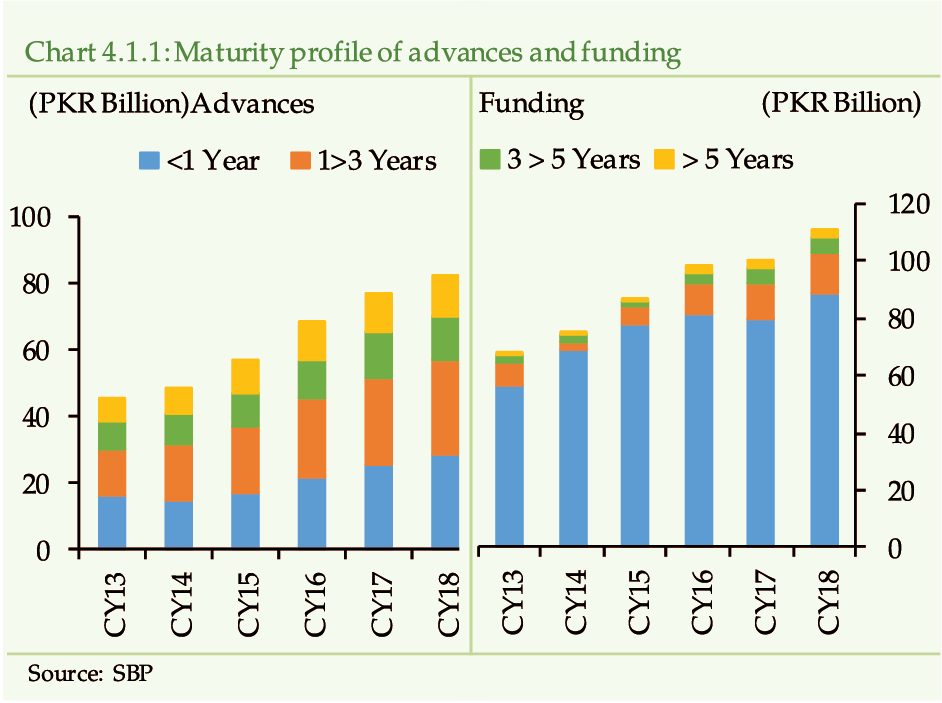
The maturity profile of advances remains
short-term oriented
Although, the advances have grown at 7.39 percent
in CY18 (11.71 percent in CY17), most of the increase has been in advances
having maturity of less than 3-years. Further analysis reveals that more
than 68.80 percent are maturing in less than 3 years, while only 14.84 percent
have maturity over five years. The size of long-term advances further reduces
to 10.50 percent if a DFI with a mandate to provide long-term housing finance
are excluded. This state of affairs is contrary to the objective of DFIs
to provide long-term project financing.
Corporate segment is the biggest borrower
though SME financing has increased
The share of corporate loans in total loans has
come down to 78.04 percent in CY18 from 79.22 percent in CY17. It has been
made possible due to deceleration in corporate financing and rise in SME
financing. Corporate loans have decelerated to 4.39 percent on YoY basis
as compared to 15.18 percent growth in CY17. The SME financing has increased
by 59.16 percent on YoY basis as compared to 26.82 percent growth in the
previous calendar year. The rise in SME financing, apart from other factors,
could be the result of indicative targets for banks & DFIs set by SBP.
Flow of advances has increased to Textile
sector
In terms of segment wise advances, the flow of
loans is tilted towards textiles followed by cement and electronics and
electrical appliances (Chart 4.1.2). As loan portfolio is well diversified
among various sectors, it pose no concentration risk.
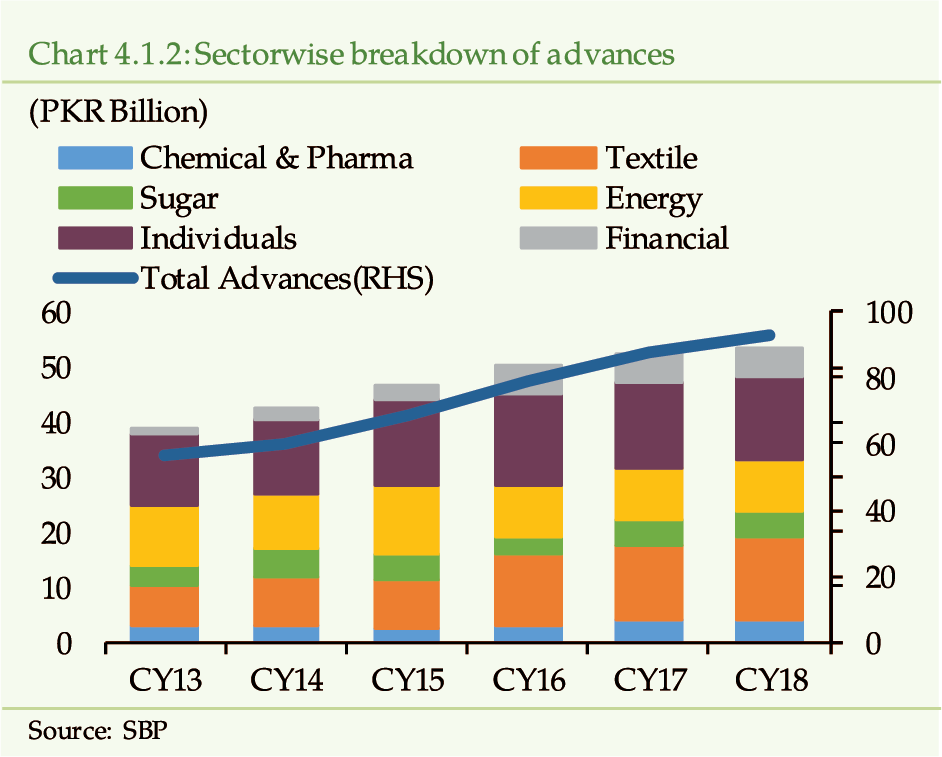
Search for yield motive dominates
investment decisions
A compositional change has occurred in the investment
portfolio of DFIs. The amount divested from government securities has been
placed in TFCs of private listed companies, likely, in search of higher
yield (Chart 4.1.3). Moreover, considering the rising interest rate
scenario, the DFIs have off-loaded T-Bills in the first quarter and then
made re-investments in PIBs in the third quarter (Table 4.1.2). Moreover,
in order to remain liquid, the DFIs have mostly kept their investments in
the Held-For-Trading (HFT) (18.09 percent) and Available-For-Sale (AFS)
(65.32 percent) categories.
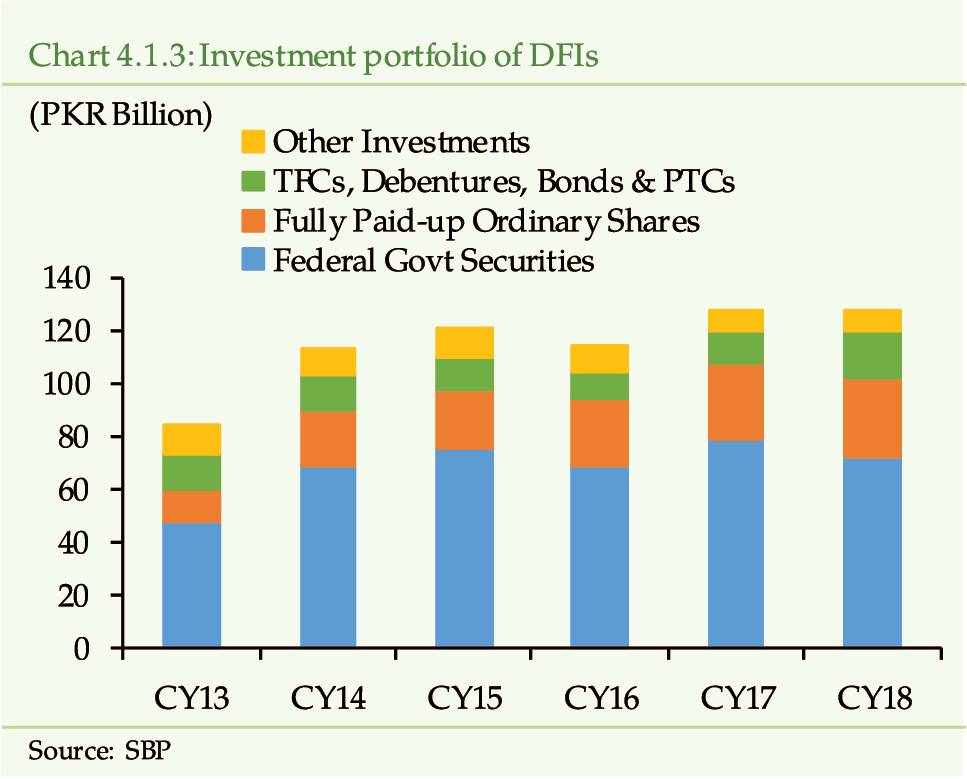
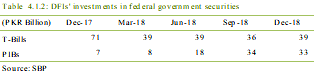
Share of deposits in funding has declined
Deposits have funded 4.88 percent of total assets
of DFIs during CY18 compared 7.51 percent in CY17. They have reduced by
31.97 percent during CY18 compared to an increase of 56.52 percent in CY17.
The decline has mainly resulted from shift in deposits to banks in search
of higher yield.
DFIs have limited avenue for mobilizing deposits.
Particularly, they raise relatively costly deposits from institutional investors
(Chart 4.1.4).
[3]
Moreover, the limited branch network further restricts their
ability to attract cost effective deposits. The DFIs need to work on expanding
outreach to mobilize additional funding necessary for enhancing the suit
of asset products, which will also be helpful in pursuing their renewed
commitment to SME financing.
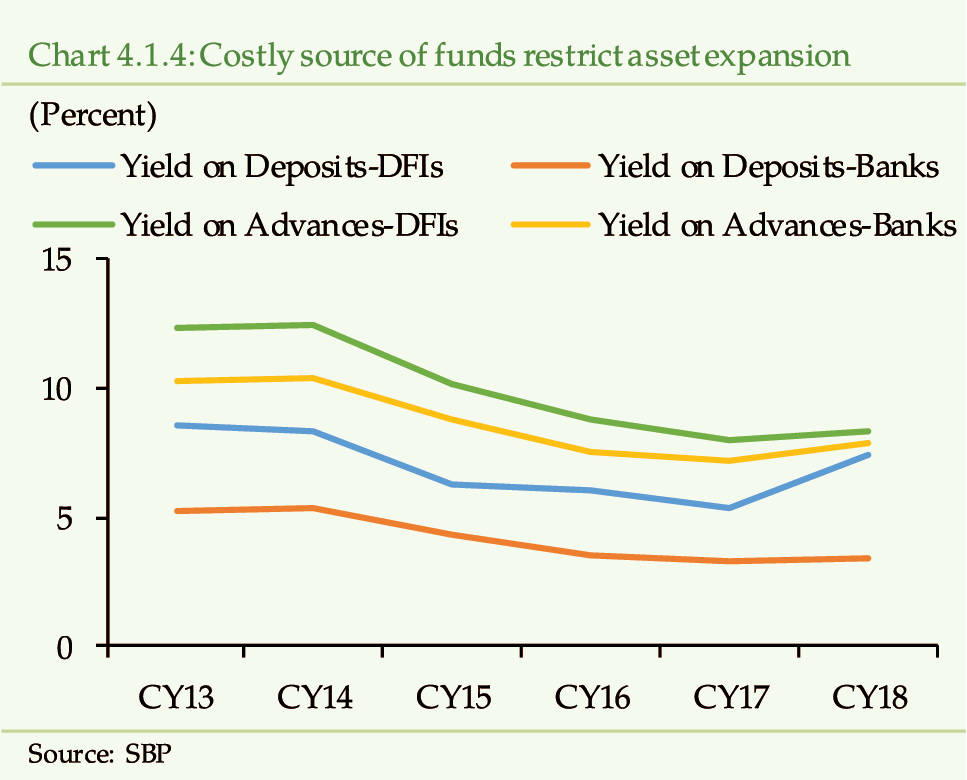
High cost of funding restricts DFIs
to play their intermediary role effectively
Besides issues in mobilizing deposits, the DFIs
have limited access to bond market because of underdeveloped capital markets.
Resultantly, they resort to inter-bank borrowings to fund their asset base.
Inter bank borrowing is actually major funding source as DFIs have funded
46.74 percent of the total asset during CY18. They rely on short term secured
borrowings to fund their assets (Chart 4.1.5). This coupled with
higher cost of funding make the borrowing expensive thus making it quite
challenging for the DFIs to expand their asset base on sustainable basis.
Shareholders equity is the prime source
of long-term funding…
The shareholders equity is the prime source of
financing long-term assets. It is funding 44.42 percent of the total asset
base. The shareholders equity increased by 8.66 percent during CY18 primarily
due to addition of a new DFI.
Asset quality of DFIs is improving
The infection ratio of DFIs has declined to 15.83
percent during CY18 (17.15 percent in CY17) (Figure 4.1.6). The decline
in infection ratio is attributed to reduction in NPLs stock and increase
in advances. Most of the NPLs i.e. 75.17 percent are parked in the loss
category. The overall provision coverage ratio is 70.28 percent at the end
of CY18. With the expansion in SME financing portfolio, DFIs need to be
proactive in managing their credit risk.
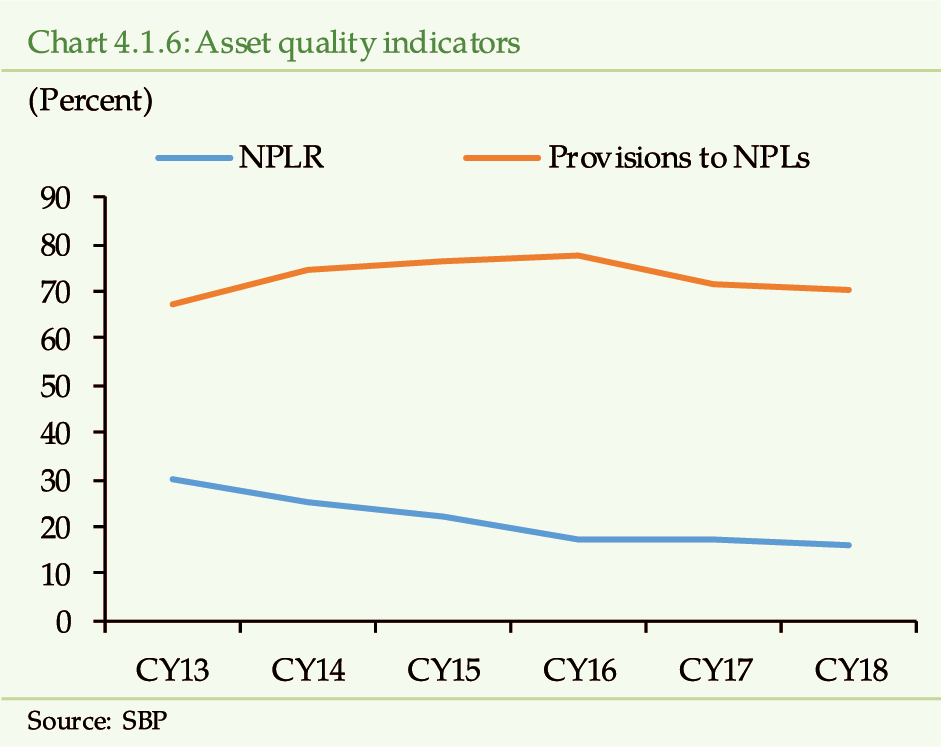
Interest income from advances has contributed
significantly in net interest income
Though the profitability of the DFIs has marginally
declined during CY18, the net markup/interest income has registered a rise
of PKR 574 million.
[4]
,
[5]
However, decline in non-markup/interest income has
declined by PKR 735 million (Chart 4.1.7). Further, rise in non-markup/interest
expense by PKR 266 million has also reduced the net profits. Resultantly,
the DFIs have posted an after-tax profit of PKR 5.0 billion in CY18 as compared
to PKR 5.4 billion in CY17. Accordingly, the ROA and ROE have also declined
on YoY basis.
[6]
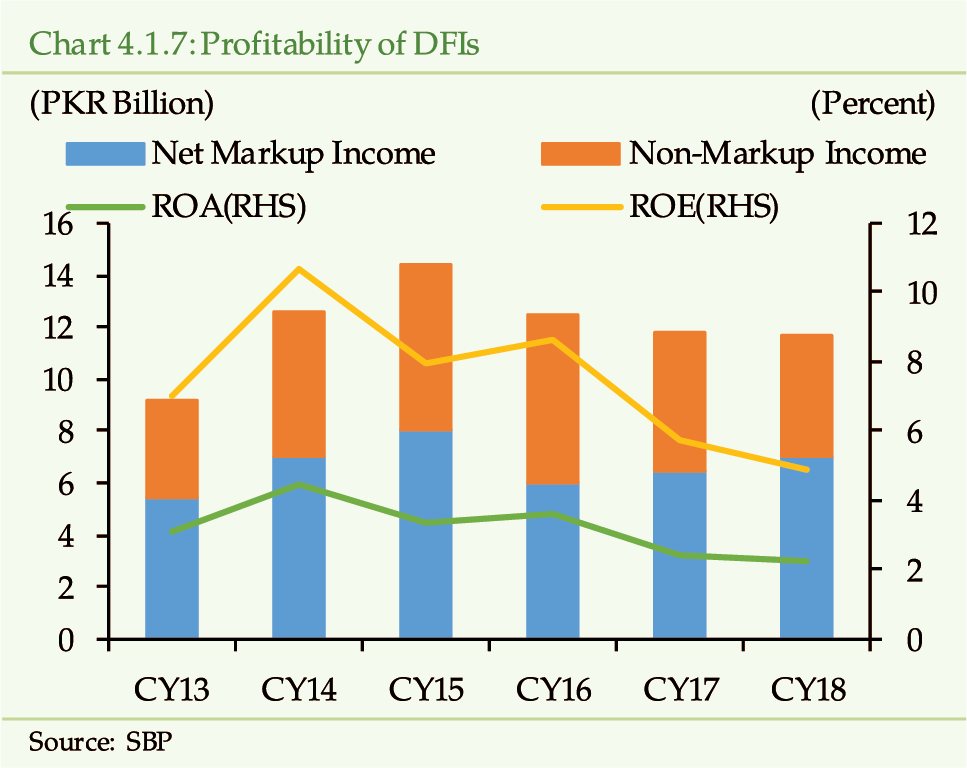
CAR remains significantly higher than
regulatory requirement...
DFIs have high CAR, indicating both underutilized
capital and capacity to enhance their financing portfolio. The CAR has marginally
declined to 46.95 percent in CY18 from 47.04 in CY17. This downward adjustment
has resulted from increase in loans due to renewed interest of DFIs in SME
financing and reduction of investments in government securities.
Need remains for enhancing the role
of DFIs for contributing in economic activity
Financial depth is the key to a resilient financial
sector, which is also one of the priorities of SBP. Enabling the DFIs to
revert to their primary role of providing long-term project financing can
help achieve this objective. The main impediment in this regard appears
to be the dearth of long-term affordable funding for DFIs. This can be arranged
through long-term cheaper credit lines to DFIs from government or multilaterals,
as in the past. The World Bank has already provided a credit line to a DFI
to refinance the existing mortgages. Besides, DFIs may explore the possibility
of securitizing their loan portfolio and issuing bonds/TFCs in the secondary
market to tap liquidity. Only then, can the DFIs be able to focus on long-term
project financing.
Box 5: Brief History of DFIs in Pakistan
In developing economies,
the DFIs have played a beneficial role by boosting the industrialization
process in the early stages of their economic development.
[7]
Besides, DFIs also bring international experience
in the domestic market, which adds to the diversity of the existing range
of financial services. Over the period, the DFIs have stepped into financing
activities like corporate financing, leasing, trade financing, refinancing,
SME financing and house financing directly competing with banks. Instead
of being a driver for economic development, the performance of DFIs in Pakistan
has remained on lower side.
History of DFIs
DFIs, around the globe,
were established in 50s and 60s, as an initiative of the World Bank Group.
[8]
The purpose of the DFIs was to support the developing countries
in industrialization process by making available long-term funding through
public sector entities. In Pakistan, pre-nationalization, DFIs had played
pioneering role in establishing the industrial base. Few of them are PICIC,
PIDC and PIFC. However, post nationalization, the DFIs incurred losses due
to their financing to loss-making public sector enterprises.
The shift in philosophy
of World Bank, globally, from project based lending to program based lending
pared down the credit lines, which further worsened the financial health
of DFIs.
The reasons for the failure
of DFIs have also been identified as strong public sector orientation, political
interference, compromised credit standards, non-performing loans and inability
to raise funds from the market.
[9]
The DFIs, in the region, which survived were those who had adjusted
to market dynamics, diversified their financial activities to strengthen
their income stream, implemented corporate governance framework and raised
their own long term funding through secondary market.
Post reforms
The experiment of nationalization
was unsuccessful to obtain the desired results of ensuring flow of financial
services to the grass root level (ibid). The government opted for financial
reforms, structural adjustment, and privatization. During reforms, few DFIs
were closed down and few suffered heavy losses and were on the brink of
shut down but rescued by government through considerable financial support.
However, post privatization, private sector banks were incorporated with
universal banking model that contributed positively in the enhancement of
financial services. At the same time, DFIs kept struggling with their financial
losses and in the absence of long-term credit lines, could not keep up with
the pace of growing banking sector.
Structure of DFIs, at present
There are 9 DFIs, out of which 7 DFIs have been established in cooperation with bilateral, one DFI is wholly owned by the Government and one DFI is established as a private-public partnership. The purpose for their establishment was to support economic development through financing the industrial sector, extend project financing and facilitate the trade between bilateral. However, their participation in the desired areas is limited due to various reasons including funding constrain
[1]
Assets of financial sector includes the assets of banking sectors,
NBFIs, Insurance and CDNS, while banking sector assets include the assets
of Banks, DFIs and MFBs only.
[2]
Pakistan Mortgage Refinance Company Limited (PMRC).
[3]
DFIs can only raise deposits through issuance of Certificates
of Investments (COIs) minimum up to maturity of 30 days. Due to limited
applicability of BCO, 1962, DFIs are not deposit taking institutions. Hence,
they cannot raise the low cost CASA deposits, which raises their cost of
funds.
The gross outstanding advances are PKR 90 billion in CY18 as compared
to PKR 85 billion in CY17. The increase in interest rates has further increased
the interest income on advances.
[5]
The average outstanding amount of investments in government
securities during CY18 has been PKR 61 billion as compared to PKR 89 billion
in CY17. Therefore, the markup/interest earned on investments has declined
by 10.57 percent during the year.
[6]
The sharp decline in ROE during CY18 is due to increase in equity
by PKR 8 billion due to entry of a new DFI.
[7]
Yaseen Anwar, 2011, Role of Financial Institutions and Capital
markets in Pakistan, Speech, PAF Air War College, Karachi, delivered on
21 December 2011.
[8]
MARTÍNEZ, J. (2017). The role of development financial institutions
in the new millennium. [Blog] World Bank Group. Available at: http://blogs.worldbank.org/eastasiapacific/the-role-of-development-financial-institutions-in-the-new-millennium
[Accessed 5 Mar. 2019].
[9]
Faruqi, S. (2015). The Role of DFIs in Industrial Growth and Transformation:
Why the East Asian Countries Succeeded and Pakistan Did Not. The Lahore
Journal of Economics, (20), pp.13-33.
4.2
Performance & Risk Analysis of Non-Bank Financial Institutions
CY18 witnessed an increase
in market risk due to volatility in stock market, political uncertainty,
rising interest rates and exchange rate depreciation. Though, the slowdown
in growth of NBFI sector has been recorded, the availability of various
investment options and addition of new firms helped to maintain the asset
size of the sector besides adding diversity. Mutual funds, during CY18,
have observed net outflow and compositional change. Investors, to safeguard
their capital, have switched their investments from equity funds to money
market funds. They have also appeared cautious as they took investment decisions
by opting non-discretionary portfolio. On the other hand, the companies
having financing mandate experienced growth in their assets, except the
leasing sector. The assets of investment finance companies have increased
on account of addition of two new companies. Further, two new modarabas,
after a long time, have been registered and floated in the stock exchange.
An increase in assets of NBMFCs has positively contributed to total assets
of NBFI sector. In addition, the increasing share of IFCs, REITs, NBMFCs
and modarabas may reduce the dependence of NBFI sector on performance of
stock market.
Addition
of new institutions add to diversity, though the tighter macrofinancial
conditions have led to a slowdown in NBFIs asset growth
The NBFI sector is continuously adding depth to
the existing financial sector by catering to the diverse needs of the end
users. The recent additions of REITs funds, Pakistan Microfinance investment
Company and Private Equity Firms further expand the scope of NBFIs. This
diversity helps minimize the adverse impact of any potential risk.
The total assets of the NBFIs, after witnessing
healthy growth in previous years (18.17 percent on an average from FY14
to FY17 (Table 4.2.1), have slowed down during FY18.
[1]
The overall expansion in NBFIs assets reflected an increase
of only 3.41 percent in FY18 as compared to growth of 31.48 percent in FY17.
[2]
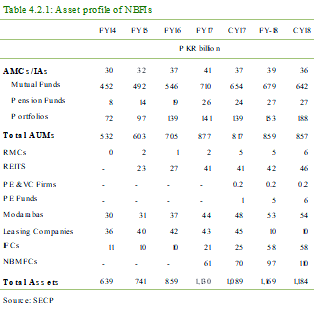
The
slowdown is more visible in NBFIs pegged with equity market
The overall slowdown in NBFIs assets can, primarily,
be attributed to deteriorating economic conditions resulting in volatility
in the equity market. The assets of Mutual Funds have decreased by 4.39
percent in FY18 compared to 29.99 percent increase in FY17. Accordingly,
their share in total assets of NBFIs has dropped to 58.10 percent in FY18
compared to 62.84 percent in FY17. The assets of AUMs have also decreased
by 2.09 percent in FY18 compared to an increase of 24.43 percent in FY17.
On the other hand, the assets of modarabas and
NBMFCs have expanded by 20.10 percent and 58 percent, respectively, during
FY18. The asset base of IFCs have also increased but mainly due to a conversion
of one large leasing company into an investment finance company.
As
is the case in banking, the Shariah compliant structures are gaining popularity
in the NBF sector
The Shariah compliant structures, which include
Shariah compliant mutual funds, Shariah compliant pension funds, Shariah
compliant modarabas and the only REIT in operation are attracting investors.
The asset size of these structures in total NBFIs assets has increased from
17.86 percent in FY14 to 31.81 percent in FY18 (Chart 4.2.1).
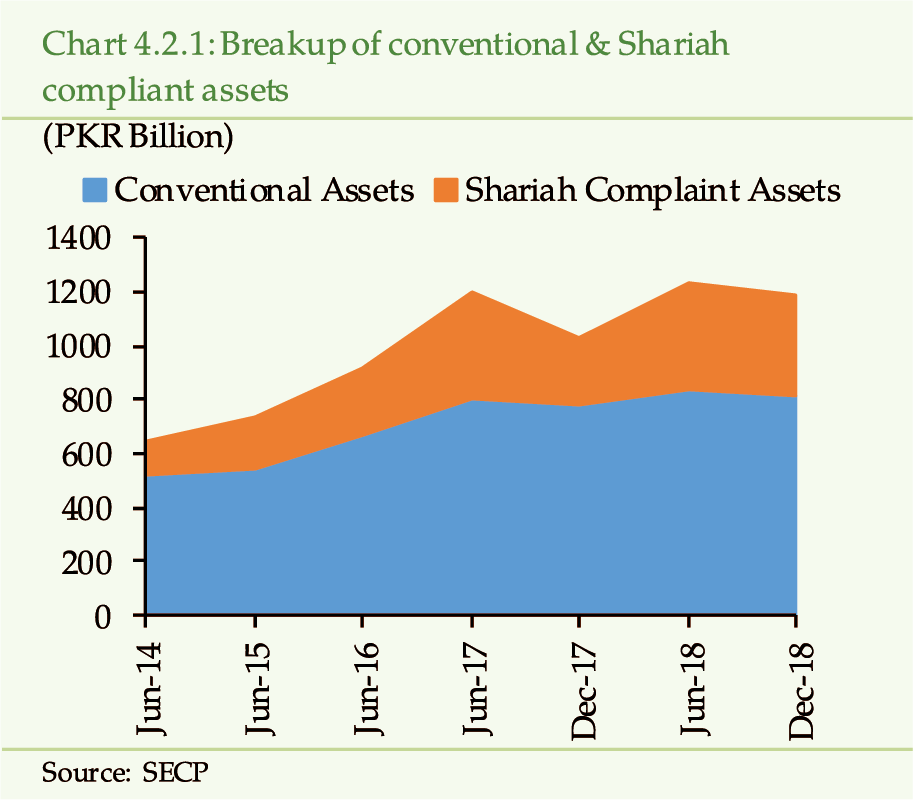
Asset valuation of mutual funds decline
in the aftermath of rising macroeconomic vulnerabilities
The value of mutual funds assets has declined
by 4.39 percent in FY18 compared to an increase of 29.99 percent in FY17.
The assets have lost another 1.91 percent value by end December 2018. The
net assets of both the conventional and Islamic equity funds have declined;
by 23.49 percent and 19.07 percent, respectively. The bearish stock market
sentiments arising out of tighter macrofinancial conditions, political transition
and uncertainty about the future economic prospects have been instrumental
in the performance of mutual funds and the behavior of their investors.
During CY18, the foreigners, banks and brokers
have been net sellers of mutual funds, while insurance, individuals and
companies have absorbed all the selling. The continuous risk aversion of
mutual fund investors may lead to further asset devaluation.
and
the “flight to safety motive prevails
Investors, anticipating further volatility due
to rising interest rate risk, have quickly switched from the equity funds
to money market funds.
[3]
There has been a decline of 21.97 percent in FY18 in the equity
mutual funds. Resultantly, the share of equity mutual funds in net assets
of the mutual funds has dropped to 39.38 percent in FY18 from 45.34 percent
in FY17 (Chart 4.2.2).
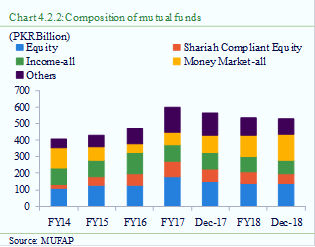
On the other hand, the value of net assets of money
market funds has increased by 67.34 percent in FY18 as compared to 40.14
percent in FY17 (47.18 percent in CY18) (Chart 4.2.3). Accordingly,
the share of money market funds in the net assets of mutual funds has increased
from 13.04 percent in FY17 to 24.30 percent in FY18 (29.86 percent at the
end of CY18).
The increasing share of money market funds, in
the prevailing macroeconomic environment, indicates low risk appetite of
the investors and inclination towards capital preservation.
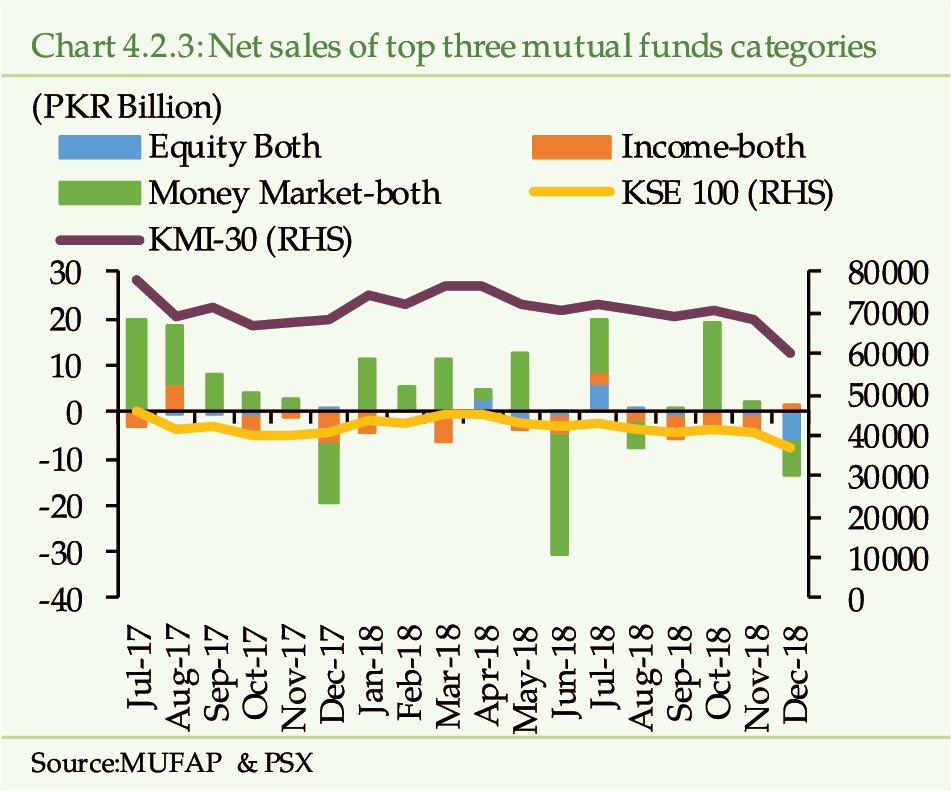
Pension
funds too have been affected by market volatility
As was the case with mutual funds, risk aversion
also prevails in pension funds (Chart 4.2.4). They have not only
receded from the equity market, they have also divested away from government
exposure. In terms of asset allocation, the pension funds have made placements
in equity securities (44.97 percent in CY18 vs. 48.62 percent in CY17),
government securities (9.05 percent in CY18 vs. 15.59 percent in CY17) and
bank balances (34.61 percent in CY18 vs. 19.43 percent in CY17). As a result,
the net asset value of pension funds could only increase by 4.11 percent
in FY18 as compared to a growth of 33.41 percent in FY17.
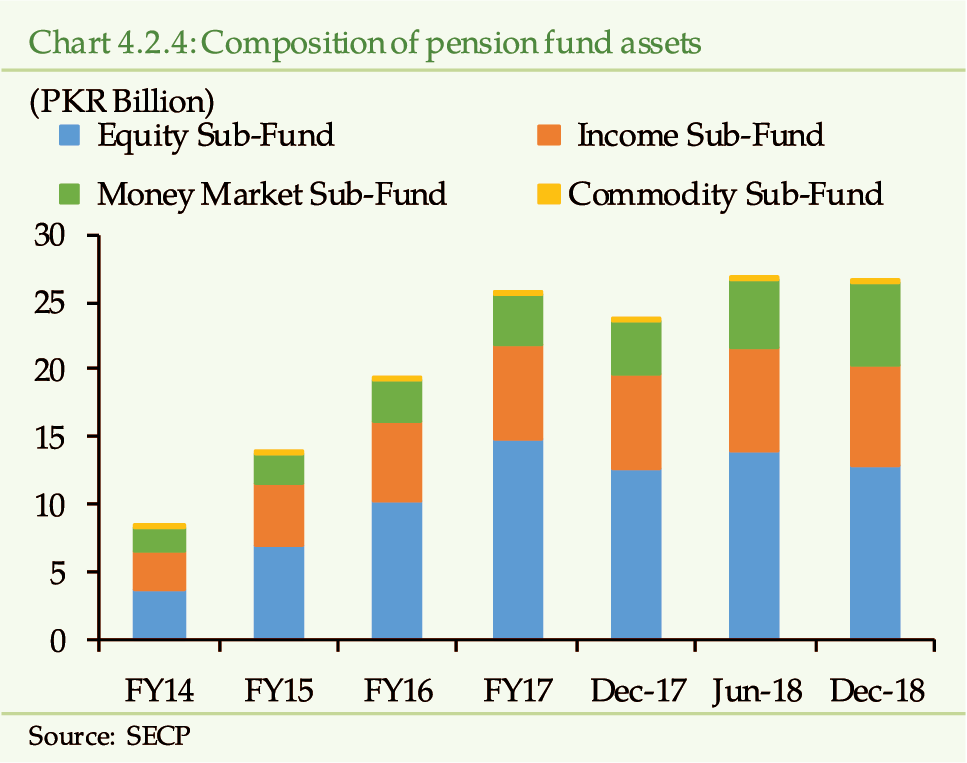
The performance of the pension funds is dependent
on the performance of sub-funds. The overall return of the pension fund
has remained on the lower side (Table 4.2.2). The returns on the
equity sub fund have been negative in FY18. However, during the same period,
the money market sub fund and debt sub fund have seen positive returns.
Despite the strong management regulatory framework for Voluntary Pension
Scheme, high volatility in the stock market may expose the sector to the
low returns, which may create socio-economic disturbance.
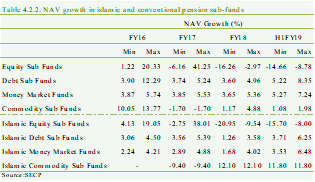
and
so is the case with high-networth individual Investors
Under the prevailing uncertainty in the market,
high-networth individual investors appeared cautious about their investment
strategy. They preferred non-discretionary portfolios
[4]
for investment during CY18. In the first half of the year, they
relied on fund managers to manage their investment, while in the second
half they took decision making into their own hands (Chart 4.2.5).
This suggests a general lack of confidence shown by the high-networth individual
investors in the ability of the fund-managers to make investment decisions
in a volatile market. However, this emerging trend may increase “trading
noise in the market, as large investors are more prone to panic sales that
may shorten investment-holding period. They may also be more risk averse
investing in blue chip stocks, which may limit the flow of funds to the
emerging sectors.
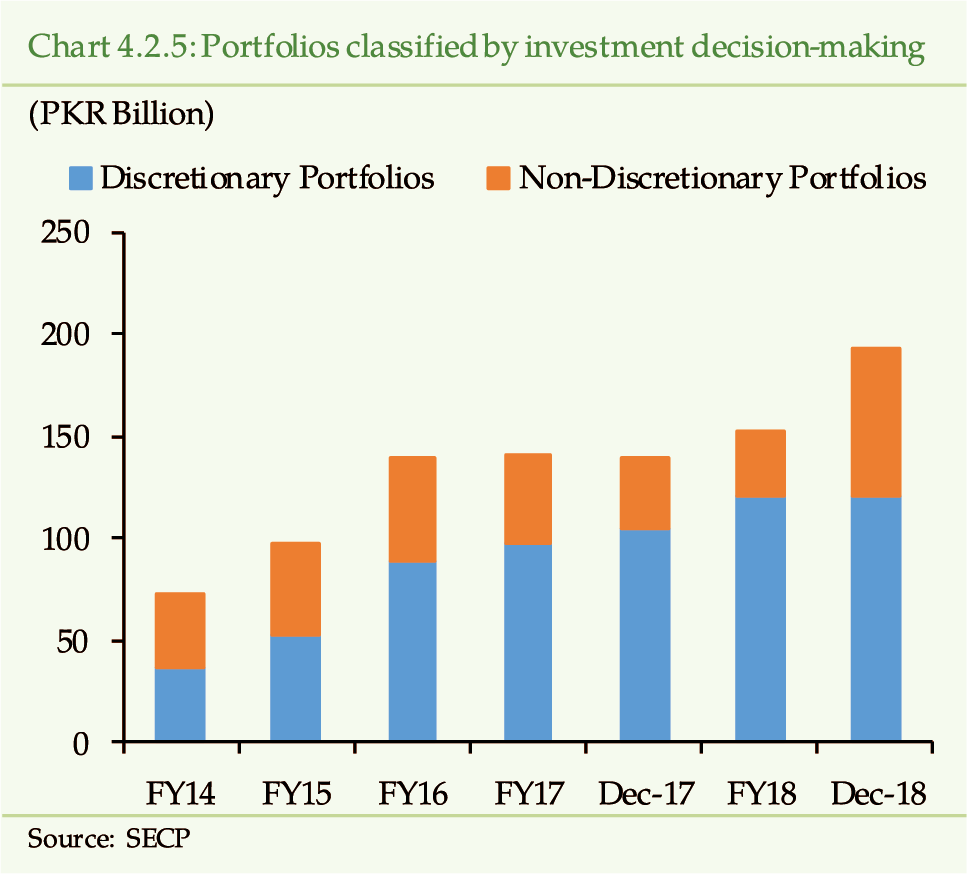
The
survival of leasing companies is at stake
The individual business of leasing is on the decline
since last few years. As opposed to forty companies in the year 2000, only
seven remain at the end of 2018. The entrance of commercial banks in the
leasing business in early 2000s and tighter liquidity conditions, made the
operating environment difficult.
Moreover, the adverse global financial shock of
2008, which resulted in a steep rise in domestic interest rate, led to an
upsurge in borrowing costs and further shortage of liquidity. Resultantly,
the companies had to utilize their rental recoveries to pay off their borrowings,
restricting new business operations. There was an upsurge in NPLs, which
forced the leasing companies to concentrate on managing their infected portfolio
rather than expanding their business. As a result, the leasing companies
either had to windup or explore other avenues for survival.
In CY18, the largest and profitable leasing company
has broaden its scope by converting itself into an Investment Finance Company.
[5]
Resultantly, the assets of the leasing sector have reduced by
76.80 percent from PKR 45 billion in CY17 to PKR 10 billion in CY18. Its
share in total NBFI sector assets has also dropped to 0.84 percent at the
end of CY18.
Further, the sector is facing poor asset quality.
The infection ratio is 73.22 percent and only 76.19 percent of the bad loans
have been provided for. Moreover, the sector is no longer profitable; the
after tax ROA and ROE stands at negative 0.53 percent and negative 0.13
percent, respectively (Chart 4.2.6).
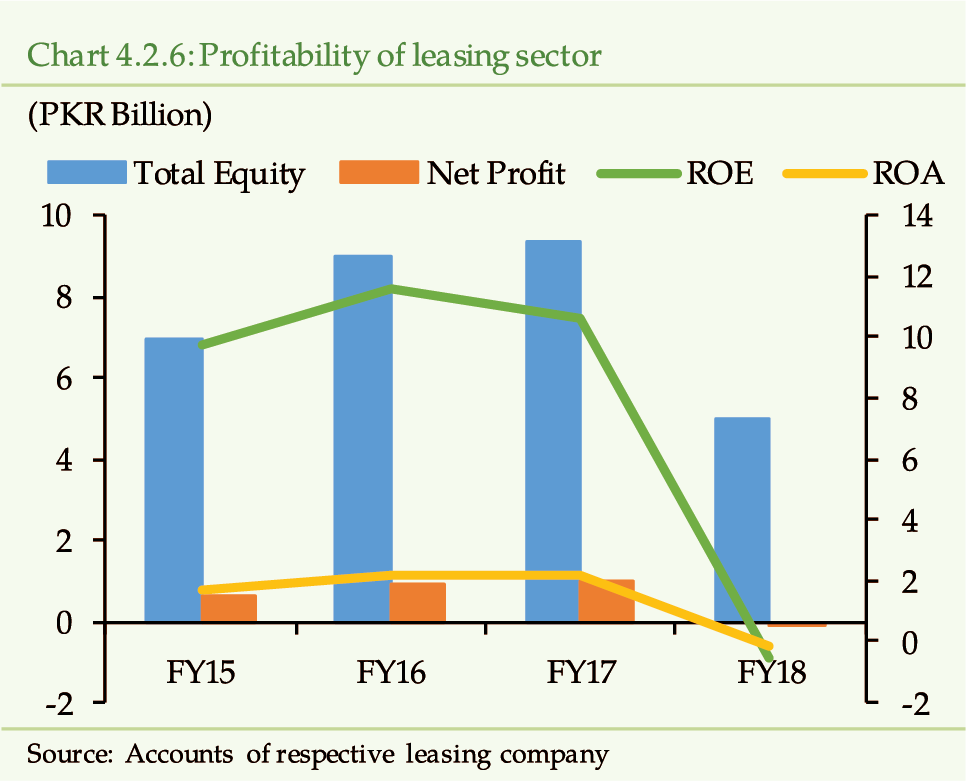
The
NBMFCs are adding depth to the NBFI sector
The non-bank microfinance companies (NBMFCs) gained
momentum during the year and registered an increase of 56.71 percent, which
contributed 43.41 percent in overall growth of NBFIs. The rapid growth in
NBMFCs is primarily due to availability of market based liquidity from Pakistan
Microfinance Investment Company (PMIC).
[6]
The purpose of PMIC is to mobilize funding from both donors and
commercial lenders i.e. development agencies, financiers, commercial banks
and capital markets and lend it further to NBMFCs.
[7]
Keeping in view the critical role being played by PMIC in the
growth of NBMF sector, the health of PMIC becomes paramount. The PMIC may
increase the interconnectedness between the banks and the NBF sector, as
it has started channelizing liquidity. As the microfinance borrowers are
deemed more risky, any asset quality concerns of NBMFCs may have repercussions
for the banking sector.
and
so are the modarabas
The growth momentum in the assets of modarabas
have continued during FY18. The assets have increased by 20.10 percent as
compared to 20.63 percent in FY17. The two new modarabas, after a long time,
having the equity of PKR 1.05 billion were floated and listed on the stock
exchange. With this addition, the number of modarabas has reached to 27.
Despite this expansion, the concentration in the
sector remains high. The top 4 modarabas constitute 73.91 percent of the
total assets of the sector. Moreover, there is still room to improve the
performance of the modaraba companies. Their potential can be achieved by
creating the awareness about the universal applicability of the concept
for undertaking multiple activities like financing, manufacturing and trading,
some of which may not be handled by Islamic banks.
Assets
of REITs have also increased due to revaluation of the underlying property
There are four REIT management companies, registered
with SECP, having accumulated asset value of PKR 5.67 billion at the end
of CY18. However, there is only one REIT scheme (the rental REIT) with a
fund size of PKR 22 billion and asset size of PKR 46 billion (Table 4.2.3).
The expansion in assets of PKR 4 billion during CY18, is backed by unrealized
valuation gains from the underlying property.
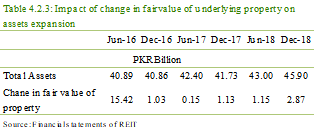
Moreover, it appears that the investors, in line
with the acceptable valuation procedures, have given more weightage to the
actual gains from operations rather than unrealized gain from property valuation.
The REIT unit has traded at an average discount of 33 percent from its NAV
(Chart 4.2.7).
[9]
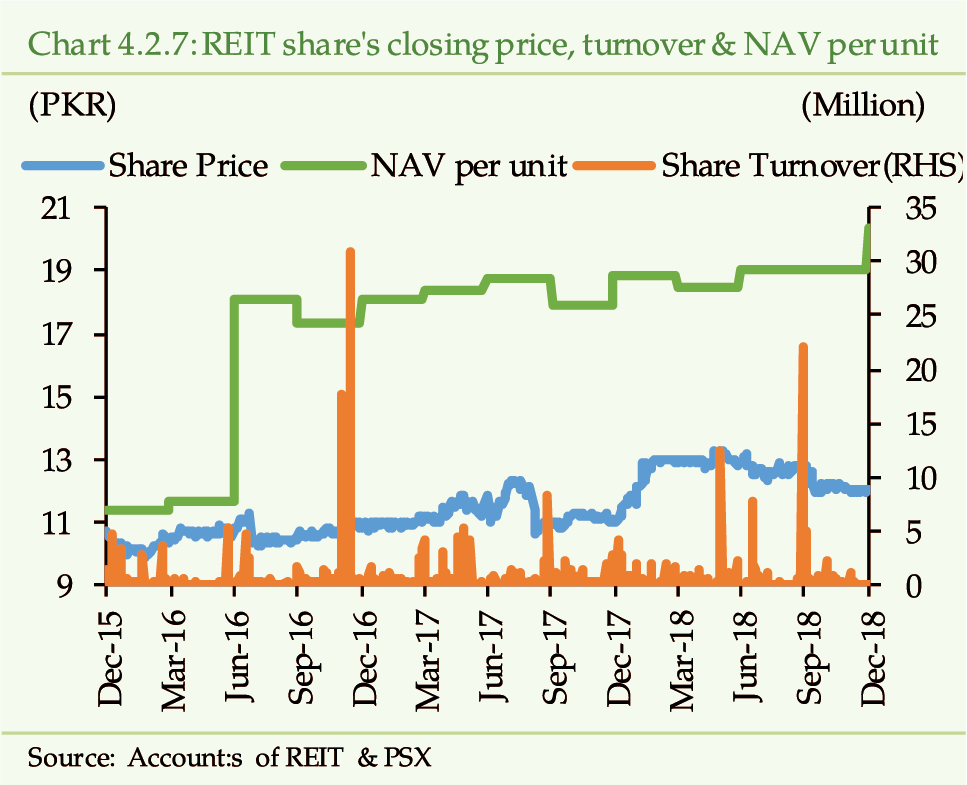
Going forward, the business of REIT is expected
to improve due to the favorable regulatory changes, introduced by SECP in
December 2018, such as allowing REITs to borrow.
[10]
This will provide impetus for the growth and enhance REITs attractiveness.
Moreover, the government is also taking measures
to promote investment in REIT. The rate of tax on dividend received by corporate
unitholders of a REIT has been reduced to 15 percent from 25 percent, vide
Finance Act, 2018. The tax rate applicable to dividend received by an individual
unit holder from a rental REIT has also been reduced to 7.5 percent. Moreover,
in case of developmental REITs the tax on dividend received by a unitholder
has also been reduced. The steps taken to promote developmental REITs would
also help the government agenda to eliminate the shortage of housing units
in the country.
The
addition of two new companies change the dynamics of the IFC sector
The number of investment companies remained same
during the year. However, one company ceased to exist due to its merger
with a brokerage house and one leasing company has been converted into an
investment finance company. Therefore, the assets of IFCs have increased
by 181.69 percent during FY18 . Moreover, two companies contain 83 percent
share in total assets of IFC as of December 2018. Both the companies are
recent addition to the IFC sector.
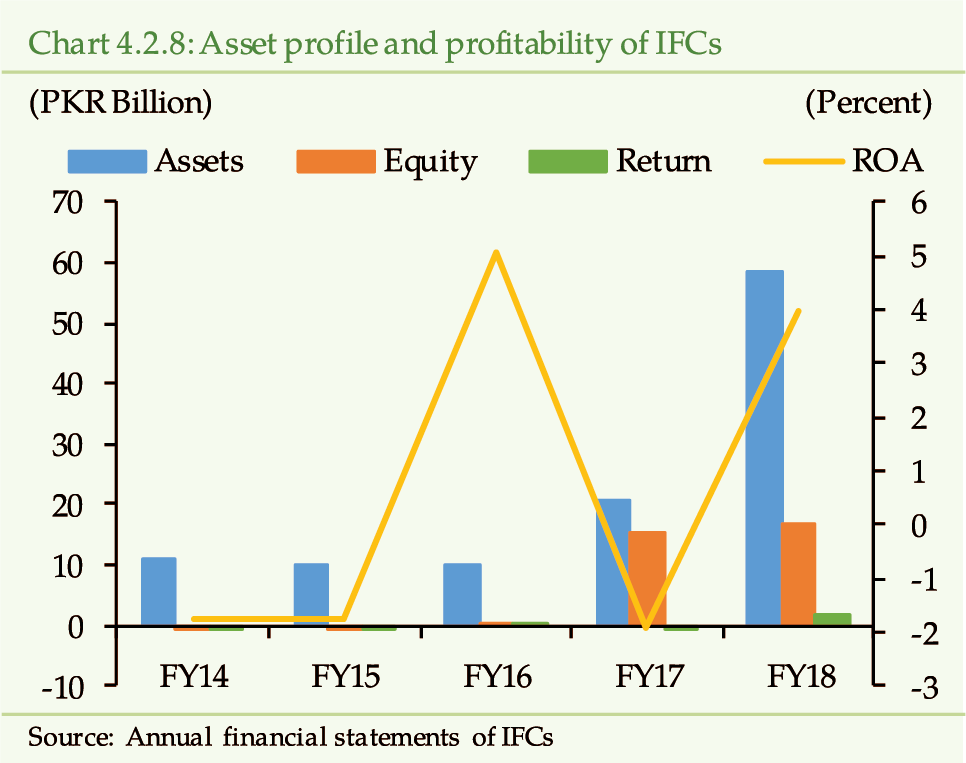
Further, with the inception of new company in CY17, the advances of IFCs have increased by 11 times from PKR 1 billion in CY16 to PKR 13 billion in CY17. Further, the conversion of a leasing company into investment finance company, the leasing assets of the IFCs have increased by more than 12 times from PKR 1.3 billion in CY17 to PKR 18 billion during CY18. Moreover, the advances and leasing assets of IFC sector have increased by more than 16 times from CY16 to CY18.
As of December 2018, the non-performing assets
to total assets have declined to 8.20 percent in CY18 compared to 18.28
percent in CY17 (62.24 percent in CY16). Further, excluding the recently
added IFCs, the infection ratio of the remaining companies stands at 34.32
percent out of which 64.78 percent has been provided for.
The new companies also had a beneficial impact
on the profitability of the sector. They have pulled out the sector from
losses. The after tax losses of PKR 294 million in FY17 have been converted
into a profit of PKR 1.6 billion in FY18. Accordingly, the after tax ROA
and ROE has increased from negative 1.9 percent and negative 3.8 percent
in FY17 to 4.0 percent and 19.8 percent in CY18, respectively.
[11]
The risks
rising from interconnectedness of the bank and non-bank sectors remain low
There are various channels of interconnectedness
between the banking and NBFI sectors. Both the sectors are mainly connected
through equity investments, borrowing/lending, investments and deposits
(Chart 4.2.9).
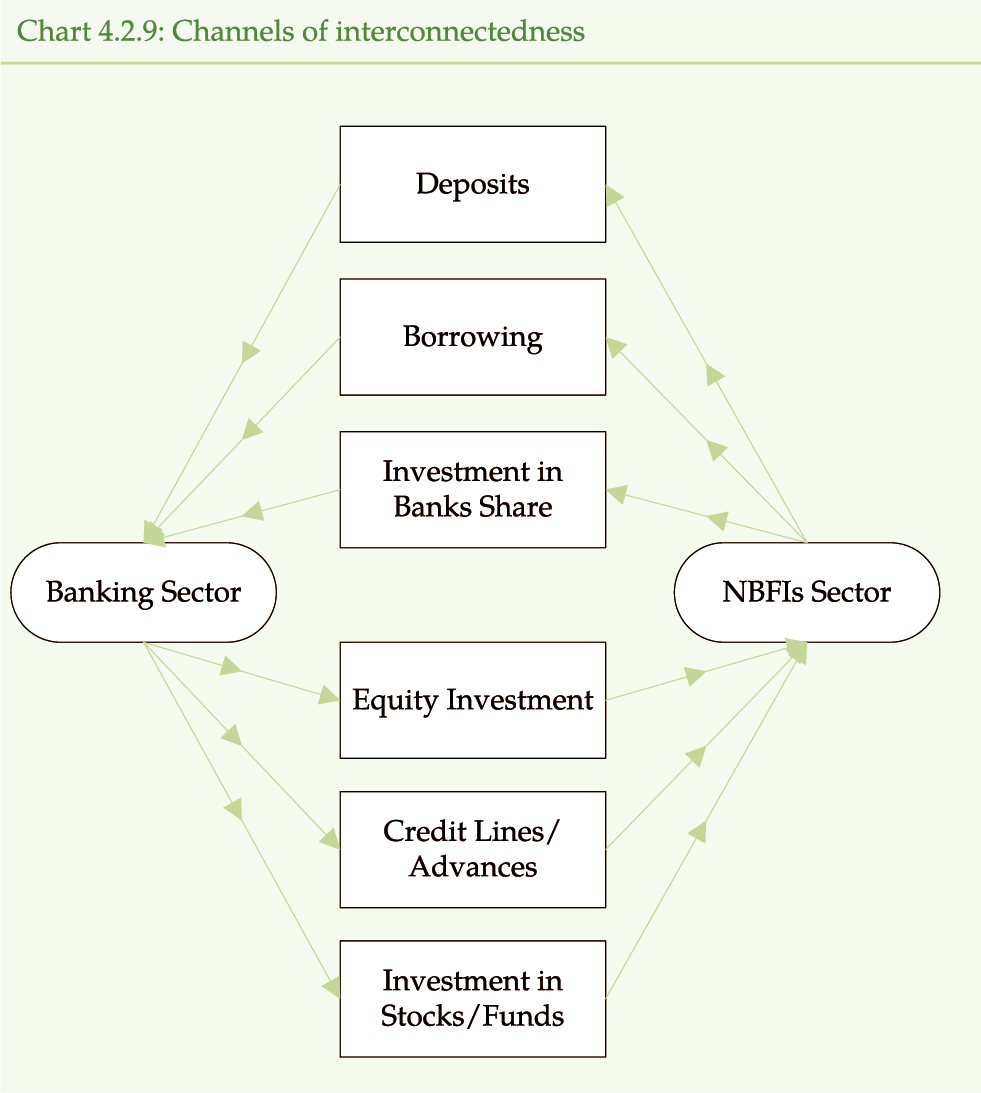
Currently, 22 AMCs and IAs are operative out of
which 11 are owned by Banks/DFIs. These 11 AMCs have floated 215 funds,
which constitute around 85 percent of the total funds. Further, banks owned
AMCs have a share of 75.41 percent in the overall assets of the segment
(73.07 percent in CY17) (Table 4.2.4). Banks have increased their
direct investment in mutual funds. However, the exposure of banks in Mutual
funds is not significant.
On the other hand, the exposure of mutual funds
on the banking sector has increased through investments in deposits, COD/TDR/COI
and money at call/Placement with the banks (Table 4.2.4).
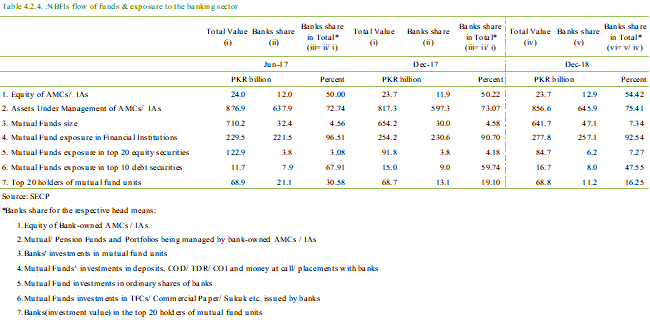
However, the slowdown in the NBFI sector has also
affected their credit needs. Accordingly, the exposure of banks on NBFI
sector in terms of credit lines has reduced during CY18 (Table 4.2.5).
Another reason for decline in credit lines from banks is the withdrawal
of liquidity requirements for mutual funds. SECP, to support mutual funds,
has withdrawn the requirement for asset management companies to arrange
credit lines from banks/DFIs equivalent to 10 percent of net assets of each
fund.
[12]
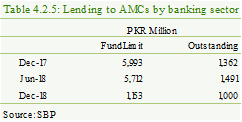
Keeping in view the relative size of deposits,
investments and borrowing by NBFIs from banking sector, NBFIs do not pose
any systemic risk to banking as well as financial system. However, they
carry high reputational risk to overall financial system.
Going forward, the development of financial markets
may enhance the complexity of the financial system and so will the interconnectedness
among financial institutions. SBP and SECP cognizant of their responsibilities
to ensure the stability of the overall financial system and safeguard the
interest of customer has taken several measures. One of them is the formation
of Council of Regulators, which periodically reviews the performance of
the financial system and assesses the risks arising thereof. Moreover, work
is underway to establish the National Financial Stability Council (NFSC),
which besides the two regulators also includes the concerned ministry.
[1]
Financial Year (FY) for NBFIs ends in June, but for the purpose
of complete analysis of CY18 and to give due coverage to the changes experienced
in the AMC segment, the Six months period from Jul-Dec, 2018 (or H2CY18)
has also been added, wherever possible.
[2]
Though the net assets of NBFIs have expanded by 1.35 percent
in H2CY18 against 3.61 percent in H2CY17, the growth is still on the lower
side.
[3]
Equity fund has witnessed net outflow of PKR 7 billion
in CY18, while net inflow in money market fund stands at PKR 39 billion.
The income funds have also observed net outflow of PKR 26 billion.
[4]
Portfolios are investments of eligible investors (person offering
a minimum of PKR 3 million investment) managed by Investment Advisors. Under
Discretionary Portfolios, investment decisions are made and executed by
the Investment Advisor on behalf of clients. While under a Non-Discretionary
Portfolio, investment decisions are made as per the written instructions
of the clients.
[5]
The company comprised 80.83 percent of total assets,
92.40 percent of deposits and 64.39 percent of the total equity of the leasing
sector.
[6]
Pakistan Poverty Alleviation Fund, Karandaaz Pakistan (KRN) and
KfW development Bank together created PMIC.
[7]
As of December 2017, the PMIC had made loans of PKR 11.49 billion
to 26 companies. This has increased to 16.67 billion (36 companies) in June
2018.
[8]
Source: Un-audited half yearly report of a REIT
[9]
REIT unit has traded at an average price of PKR 12.51, with a
maximum of PKR 13.70 and a minimum of PKR 10.86. While, the average NAV
has been around PKR 18.83, with a maximum of PKR 20.32 and minimum of PKR
18.44.
[10]
SECP SRO1473(I)/2018-Notification for REITs Amendments dated
5/12/2018 available at: https://www.secp.gov.pk/laws/notifications/
[11]
In FY16, the ROA of IFCs improved noticeably due to recognition
of additional tax asset of PKR 480.8 million in respect of unabsorbed tax
depreciation and carry forward unused tax losses.
[12]
Direction no. 37 of 2017 dated December 29, 2017 available at:
https://www.secp.gov.pk/document/circular-no-37-2017-withdrawal-of-liquidity-requirements-for-mutual-funds/?wpdmdl=30212
4.3 Insurance Sector Performance and Risk Analysis
Despite
volatility in the domestic financial markets, which has affected investment
income from equity securities, the insurance sector has performed well in
CY18. The sector has registered an increase in gross premiums of 9.45 percent
mainly due to healthy growth in renewal premiums in the life insurance sector.
Further potential for growth exists as the insurance penetration level in
the country is less than 1 percent of GDP, which is well below the global
average of 6.3 percent recorded in 2016. However, in the current macrofinancial
environment, it is expected that the growth trajectory may decelerate in
CY19. In addition, the sector is exposed to concentration, market and geo-political
risks; while limited domestic avenues for re-insurance can lead to exchange
rate risk.
Global
insurance premiums are expected to continue to grow in 2019
[1]
…
In the global non-life sector, premium rates have
slightly improved in 2018 (3.3 percent) on the back of strong growth in
Agriculture Insurance in China and India. Premiums are expected to continue
to grow at 3 percent for both life and non-life in 2019-20 driven, in part,
by the EMDEs. (Table 4.3.1)
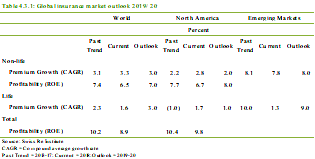
However, underwriting performance needs to be strengthened
in order to improve profitability in an environment of increasing claims
in the non-life insurance sector. The marine segment is expected to be affected
by a potential trade slowdown, which will lead to an overall decline in
premiums for non-life. However, pricing has improved in the motor segment.
Overall, pricing and underwriting results in non-life are expected to remain
stable in 2019.
In 2018, global life insurance premiums have grown
by 1.6 percent (which is lower than the average annual growth rates of the
last five years) mainly on the back of premium growth slowdown to 1.3 percent
in emerging markets (including China). China is estimated to have had a
substantial contraction (-1.8 percent) in life premiums due to introduction
of tighter regulation of wealth-management-product (WMP)
[2]
types. However, the life premiums for emerging markets
are expected to accelerate to 9 percent in the coming two years with China
accounting for the WMP shock. While profitability has improved in life insurance
sector, the general low interest rate environment remains a concern. Since
interest rates are expected to remain stable at current levels (with only
marginal increases), life insurers are looking for high equity valuations
and diversifying their assets to maintain adequate returns and curb their
exposures to market downturn.
Overall, global insurance premiums are expected
to grow at around 3 percent in 2019-20 due to above potential global economic
growth with emerging markets (especially China) again being the main drivers
of premium growth.
In premium-equivalent terms, the global mortality
and property protection gap has been estimated at USD 500 billion in 2018,
which is about 70 percent of the respective insurance markets. The gap highlights
the enormous potential for insurers and if they are able to increase coverage,
they can help strengthen the resilience of the global economy.
The EMDEs are expected to continue to spearhead
demand for insurance in the coming years. The low insurance penetration
in these economies, coupled with increasing wealth, indicate potential for
growth.
In
Pakistan, insurance sector has continued its upward growth trajectory
Low insurance penetration (0.83 percent of GDP)
indicates that there is room for growth in the Pakistani insurance sector
(Global insurance penetration = 6.3 percent in 2016
[3]
).
The asset base for the insurance sector
[4]
has been estimated to have grown by 10.88 percent to PKR 1,435
billion as of December 31, 2018 mainly due to an increase in the Life Insurance
business. Investments and properties have registered an increase of 12.11
percent to PKR 1,128 billion as of December 31, 2018. (Table 4.3.2)
Equity for the industry has increased by 5.87 percent
to PKR 119 billion in CY18 as insurers try to comply with the enhanced regulatory
paid-up capital requirements.
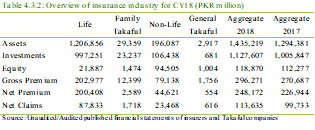
Growth
in the life sector has been driven by an increase in its core business
The assets for the Life Insurance sector grew by
11.92 percent to PKR 1,207 billion for CY18 as life insurers increased their
Total Investments by 13.52 percent to PKR 997 billion; investments now constitute
82.63 percent of Total Assets.
Life insurers are considered among the large institutional
investors for capital and debt markets. Given the volatility in the financial
markets, life insurers have decreased their share of investment in equities
from 20.32 percent in CY17 to 18.10 percent in CY18 while increasing their
share of investment in fixed income and term deposits from 1.93 percent
in CY17 to 5.38 percent in CY18. Life insurers continue to have a significant
portion (76.14 percent in CY18) of their investments in government securities.
In addition, the dominant public life insurer has
increased its investments in properties by 14.82 percent to PKR 3.7 billion;
overall, investment in properties constitutes 0.37 percent of total investments
in CY18.
Growth rate comparison of real GDP and real gross
premiums for the life sector shows a positive correlation indicating that
an increase in economic activity may lead to an increase in gross premiums
for Pakistan. (Chart 4.3.1)
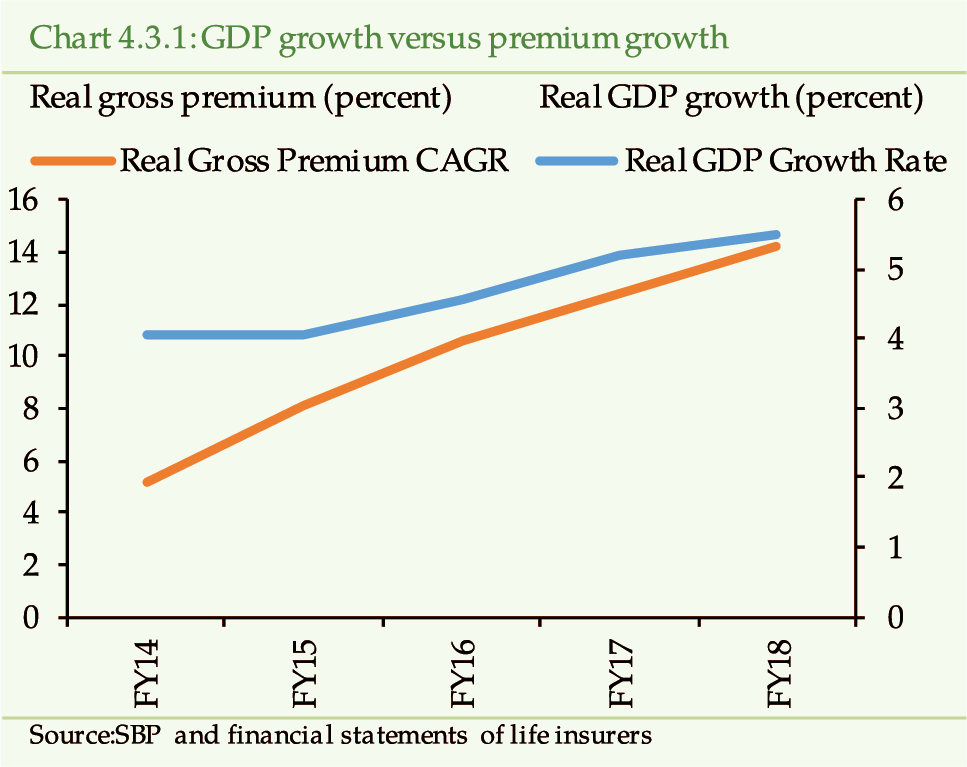
Total gross premium for Life insurance sector has
increased to PKR 203 billion in CY18 from PKR 185 billion in CY17. The increase
of 19.46 percent in Subsequent Year Premium to PKR 109 billion, coupled
with the 12.55 percent YOY increase in Second Year Premium, signifies that
the sector has been able to retain its business. Moreover, the First-Year
Premium to Gross Premium sustained its growth of 9.40 percent in CY18 indicating
that the sector sustained issuance of new insurance policies. The increasing
interest rate environment may have led policyholders to look for better
rates, which may have led to redemption of policies; this is supported by
the spike in Surrender Claims
[5]
in CY18. (Chart 4.3.2)
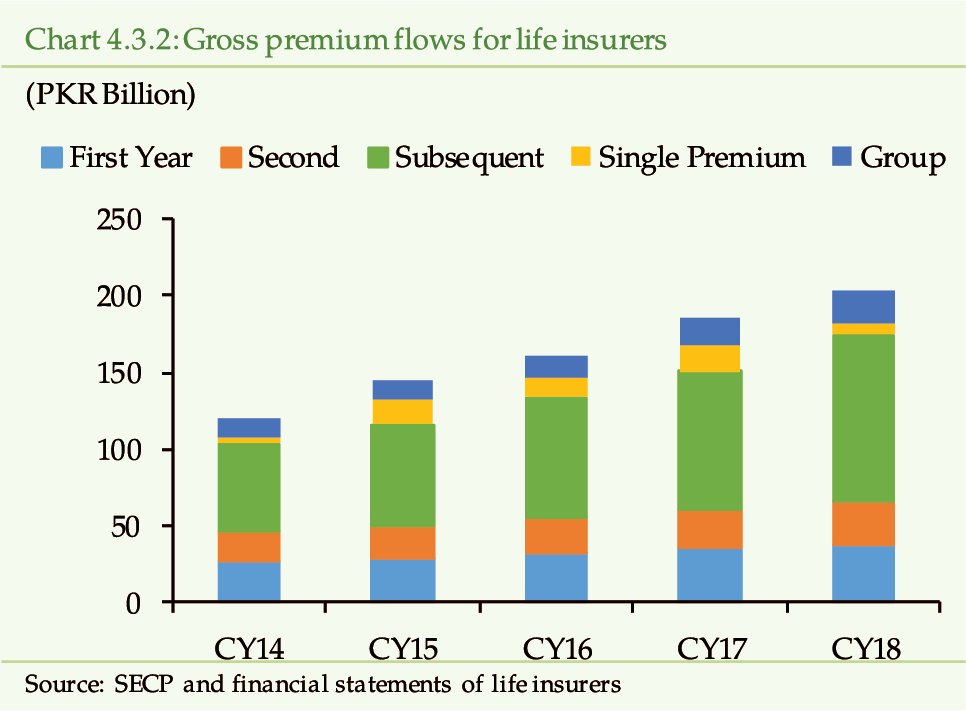
However, there has been a substantial decline in
Single Premium from PKR 16 billion in CY17 to PKR 7 billion in CY18 as a
private life insurer registered a significant decrease in this category
over the last year. This policy (along with other life insurance policies)
is used to claim tax rebate. The reduction in tax rates in 2018 along with
the prevailing inflationary pressures (which reduces the net future value
of the upfront single premium) may have lowered the demand for this product,
as they may no longer form an attractive tax saving option.
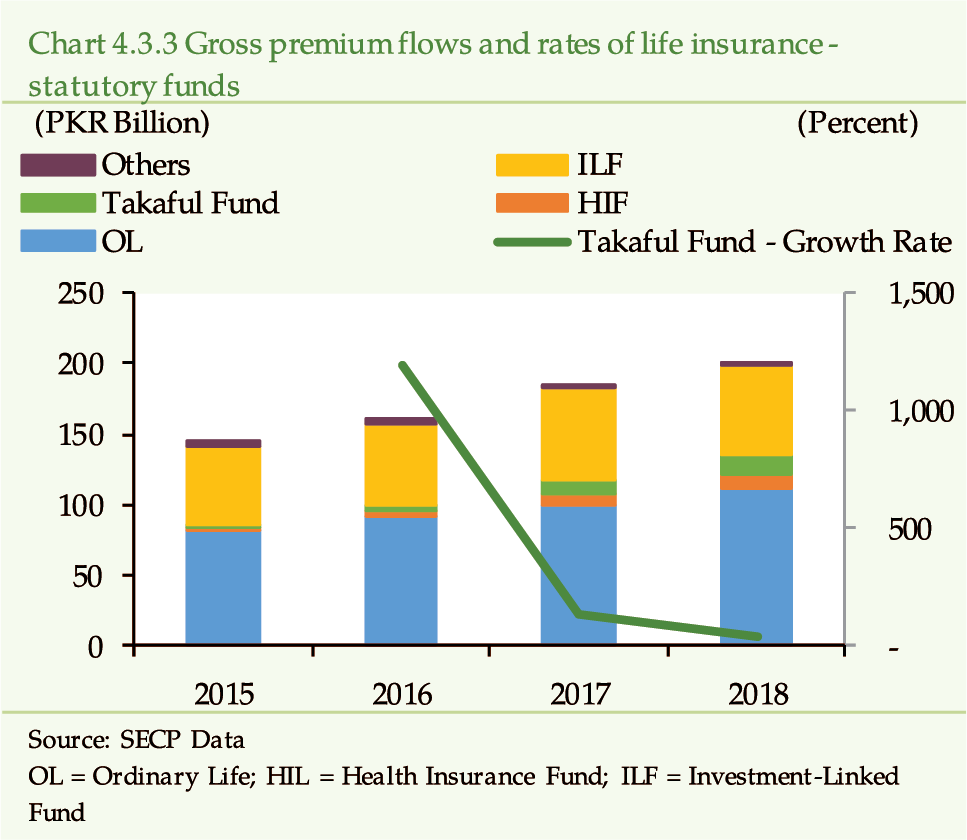
Life insurers are required to maintain statutory
funds in respect of each class of life insurance business; statutory finds
are separate from shareholders fund, which contains only those assets and
liabilities that are solely attributable to the life insurer. Analysis of
statutory funds
[6]
indicates that Family Takaful Fund has shown extraordinary
growth for Gross Premiums in CY16 and CY17 of 1190.61 percent and 136.58
percent, respectively. While this illustrates the widespread demand for
an Islamic alternative to conventional insurance, the growth rate of Gross
Premiums for Takaful Fund is extraordinary because of the small base in
2015. This is demonstrated by the lower (albeit still impressive) growth
rate of 34.61 percent to PKR 14 billion in Gross Premiums for Takaful Fund
in CY18. Ordinary Life, which includes individual and group insurance, still
forms the largest statutory funds; its Gross Premiums have increased from
PKR 100 billion in CY17 to PKR 112 billion in CY18. (Chart 4.3.3)
Due to the initiatives of one of the provincial
government to increase health coverage for its population, the gross premium
for the public life insurers Health Investment Fund has increased by 38.83
percent to PKR 5 billion in CY18. It is expected that there will be further
growth in this Fund as the federal government has re-launched a national-wide
health insurance program.
Claims under individual policies increased from
PKR 63 billion in CY17 to PKR 72 billion in CY18. This was mainly due to
increases of PKR 4 billion and PKR 3 billion to PKR 44 billion and PKR 16
billion in Surrender Claims and Maturity Claims, respectively. Surrender
Claims, forming 49.24 percent of Gross Claims for CY18, have registered
a 19.05 percent YOY increase, indicating that significant number of policyholders
are exiting from their insurance policies before maturity; this development
may lead to maturity mismatches for the sector. Several factors have led
to an increase in Surrender Claims including the prevailing financial market
conditions, which has reduced the value of unit-linked policies (with significant
investments in equities); this, coupled with the increasing interest rates,
may possibly lead policyholders to surrender their policies in search of
higher yields. In addition, in order to meet their sales targets, agents
may encourage recycling of policies, which increases Surrender Claims.
While the Life Insurance sector is relatively stable, some of its indicators have started to deteriorate slightly. Return on Assets has decreased from 0.79 percent in CY17 to 0.69 percent in CY18, as there was only a marginal increase in profitability compared to a significant increase in the asset base for the sector. Profitability was affected due to an increase in management and marketing expenses as some insurers invested in their branch network, salesforce, IT software, etc. for higher future returns. (Table 4.3.3)
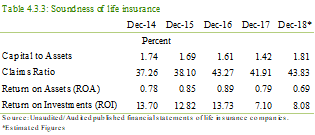
In addition, the Claims Ratio has increased from 41.91 percent in CY17 to
43.83 percent in CY18, which is still quite comfortable. In addition, the
Return on Investments has increased from 7.10 percent in CY17 to 8.08 in
CY18 due, in part, to a tightening of monetary policy in CY18 as the sector
maintains a significant portion of investments (76.14 percent) in government
securities.
Window
Takaful Operators (WTOs) are expected to drive growth in the Family Takaful
segment
The asset base for the Family Takaful segment
[7]
[Full-Fledged and Window Takaful Operators (WTOs)]
has expanded to PKR 42,564 million as of December 31, 2018. (Table 4.3.4).
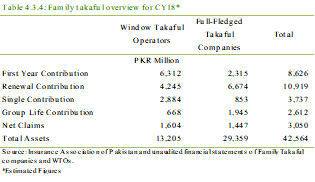
WTOs have accounted for 73.17 percent share in
First Year Contribution for Family Takaful, which supports the premise that
growth in this sector in the future will be driven by WTOs. In addition,
WTOs viability can be ascertained by their significant Renewal Contribution
(which indicates their ability to retain customers).
Since these are the initial years of operations,
it is expected that the Claims ratio will rise for WTOs (11.37 percent in
CY18) as policies become payable in line with that for Full-Fledged Family
Takaful companies (45.01 percent in CY18).The growth rate for the WTOs will
eventually slowdown as they reach maturity.
The Surplus before Tax for WTOs is PKR 239 million
for CY18. While most WTOs have posted losses for CY18, one WTO has posted
a Surplus before Tax of PKR 313 million as it has recorded substantial Net
Written Contribution in its Individual Family Takaful business for CY18
while Net Claims will only begin to increase as policies become payable.
In addition, Family Takaful companies have posted
a Profit before tax of PKR 243 million in CY18.
Non-life
sector has witnessed an increase in profitability in CY18
The asset base for the non-life sector grew from
PKR 191 billion in CY17 to PKR 196 billion in CY18 mainly due to an increase
of 46.81 percent in investments in term deposits to PKR 12 billion in CY18.
The non-life sector has reduced its overall investments
portfolio from PKR 109 billion in CY17 to PKR 106 billion in CY18 as it
has divested investments of about PKR 6 billion from subsidiaries and associates
(to PKR 27 billion as of CY18). The sector still maintains a significant
portion of investments in equity securities (42.34 percent of Total investments
and properties portfolio in CY18). (Chart 4.3.4).
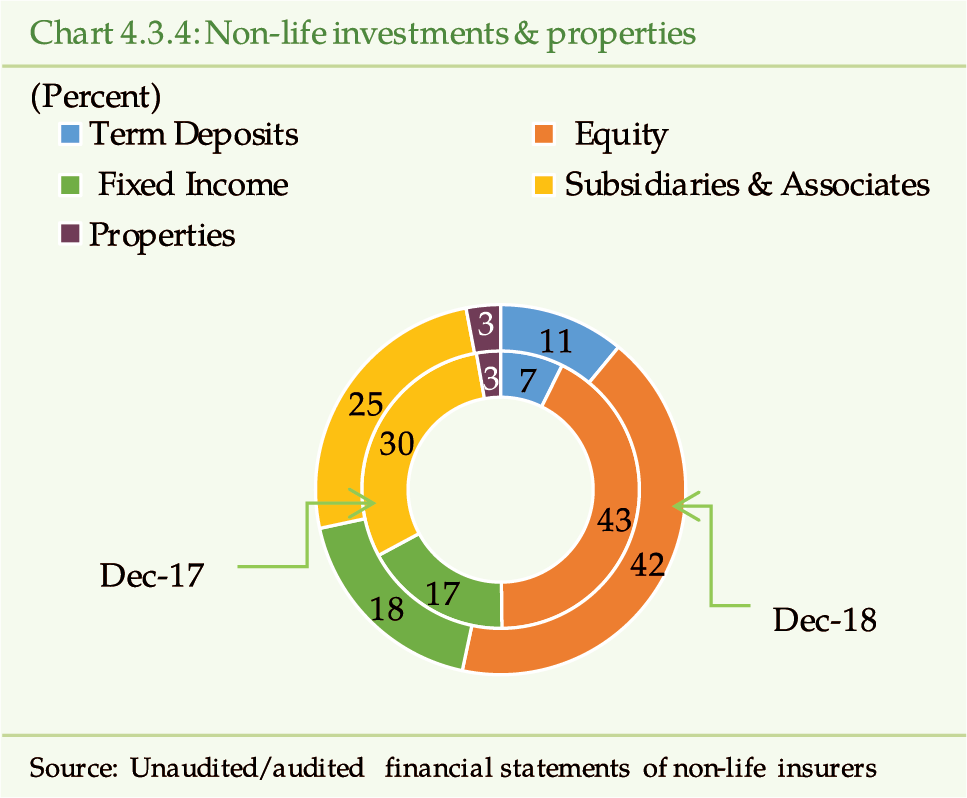
The sector witnessed a 6.45 percent increase in
Gross Premiums to PKR 79 billion in CY18 with Fire & Property Damage
and Motor segments being the main contributors of growth.
Net Claims for the Non-life sector grew by 10.06
percent to PKR 23 billion in CY18 mainly due to an increase in Claims against
the Motor segment of less than PKR 1 billion. However, the Claims ratio
for the Motor segment has declined from 55.06 percent in CY17 to 52.67 percent
in CY18, indicating that the absolute increase in motor segment claims is
due to an increase in underwriting business for the Motor segment. (Chart
4.3.5)
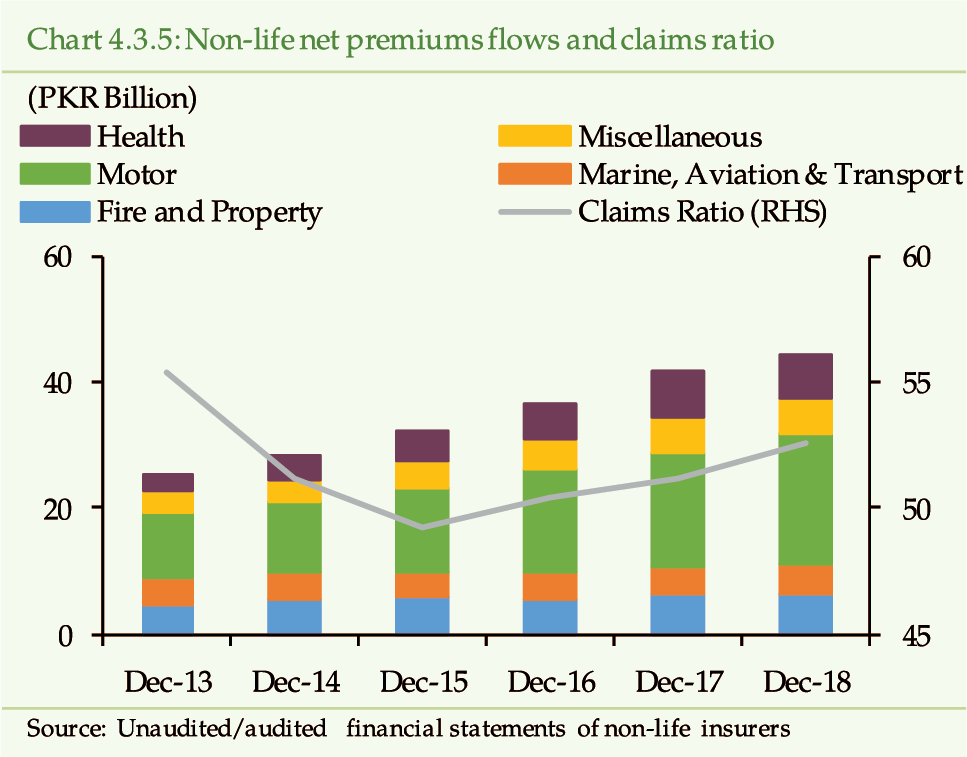
Overall, the Non-Life sector has witnessed a slight
increase in Profitability to PKR 12 billion for the year ended December
31, 2018 (an increase of 0.84 percent over last year) as the underwriting
performance for the sector has improved by 13.52 percent to PKR 5 billion
in CY18. The improvement in its core business profitability is due to a
42.90 percent reduction in commission expense to PKR 2 billion. However,
investment income has slightly decreased by 3.48 percent to PKR 6 billion
in CY18 as the non-life sector maintains 42.34 percent share of its investment
portfolio in equities, which has been affected by the volatility in the
financial markets. (Chart 4.3.6)
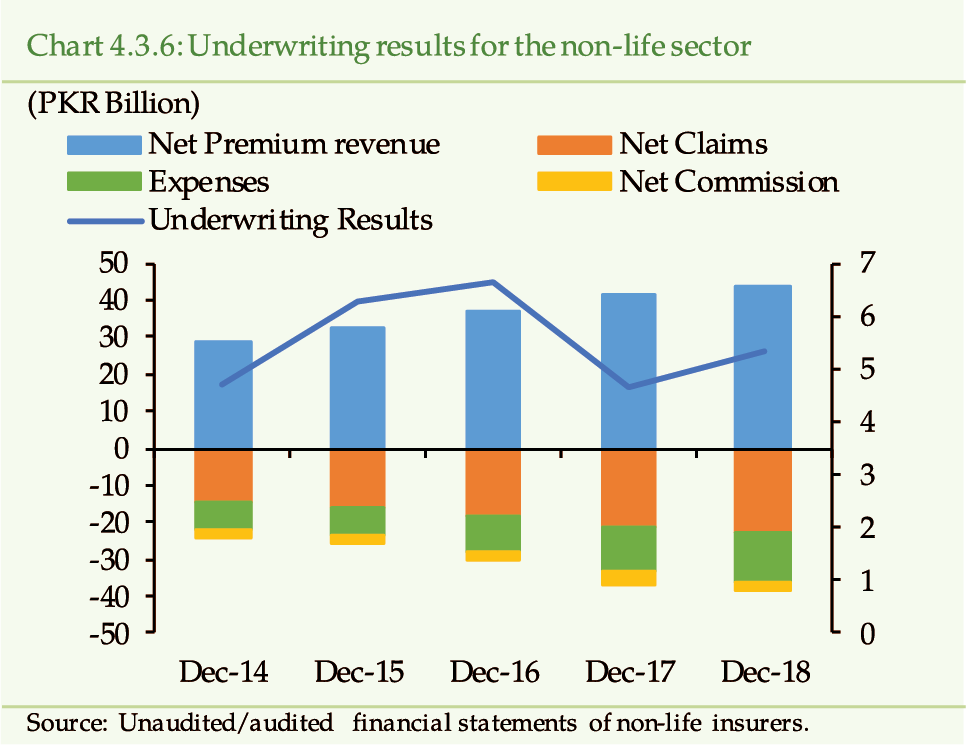
Accordingly, the Return on Investment (ROI) has
decreased. The Claims ratio for the non-life sector has slightly increased
due to a relative increase in Net Claims. Overall, the Non-life sector is
stable based on its financial soundness indicators. (Table 4.3.5)
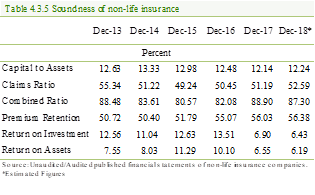 The claims ratio for general takaful segment has declined in CY18
Window Takaful Operators (WTOs) have led to a 31.96
percent jump in the asset base of the General Takaful segment
[8]
to PKR 11,476 million as of December 31, 2018. (Table 4.3.6)
The Gross Premiums for the segment have increased
from PKR 6,430 million in CY17 to PKR 7,872 million in CY18. Net Claims
for the sector have increased by PKR 769 million to PKR 3,008 million in
CY18. The 34.31 percent YOY increase in Net Claims is still less than the
87.26 percent increase in Net Premiums, which bodes well for the segment.
This has led to a decline in the Claims Ratio for
the overall General Takaful segment; it has declined from 86.83 percent
in CY17 to 62.28 percent in CY18. The Claims ratio is expected to decline
to the levels witnessed by the non-life sector (52.59 percent in CY18) as
the segment is expected to continue its impressive growth trajectory for
the next year which will help spread risks over more customers (thus, reducing
the claims ratio).
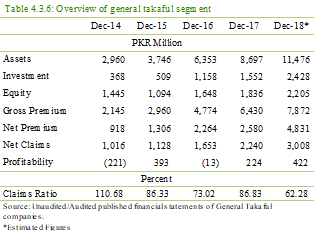
Profitability for the General Takaful segment has
improved from PKR 224 million in CY17 to PKR 422 million in CY18 mainly
due to a 108.60 percent increase in Net Contribution for WTOs to PKR 4,277
million.
In addition, the WTOs have been able to reduce
their Claims ratio from 81.21 percent in CY17 to 55.95 percent in CY18,
as WTOs have been able to exploit economies of scope of their conventional
companies, which has helped them increase their gross premiums. Consequently,
the share of WTOs in the General takaful segment profitability has increased
from 40.01 percent in CY17 to 69.72 percent in CY18.
The
reinsurance company has posted healthy underwriting results in CY18
Section 41 of the Insurance Ordinance, 2000 requires
insurers to maintain reinsurance arrangements for insurance risk management
as mentioned in the Ordinance.
The Pakistani insurance industry has only one public
reinsurer, which caters to the non-life sector. To meet their reinsurance
needs, the Pakistani insurance industry has reinsurance arrangement with
leading international reinsurers such as Hanover Re, Swiss Re, Munich Re,
etc.
The public reinsurer has increased its asset base
from PKR 24,342 million in CY17 to PKR 24,831 million in CY18. Gross Premium
has increased from PKR 8,036 million in CY17 to PKR 10,734 million in CY18
as all segments (including Treaty business and Facultative business) were
profitable. Gross Premium for treaty business, which forms 41.57 percent
of the total portfolio, increased by 32.44 percent to PKR 4,462 million
in CY18. (Table 4.3.7)
The Claims Ratio for the reinsurer has decreased
from 74.71 percent in CY17 to 54.76 percent in CY18 due to a 9.15 percent
increase in Net Premiums and a 20 percent decrease in Net Claims over CY18,
which is a PKR 748 million decline in overall Net Claims. Net Claims for
the Engineering segment was the main contributor to the decline as it fell
from PKR 500 million in CY17 to PKR 60 million in CY18.
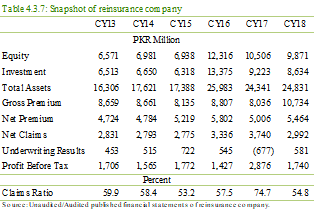
The underwriting results for the reinsurer have
registered a profit of PKR 581 million in CY18 after registering a loss
of PKR 677 million in CY17. Despite an improved underwriting performance,
the reinsurers overall profitability registered a decrease to PKR 1,740
million in CY18 compared to PKR 2,876 million in CY17. This was due to a
one-off Gain on sale of NIT units worth PKR 2,791 million in CY17, which
inflated the profits for that year. (Chart 4.3.7)
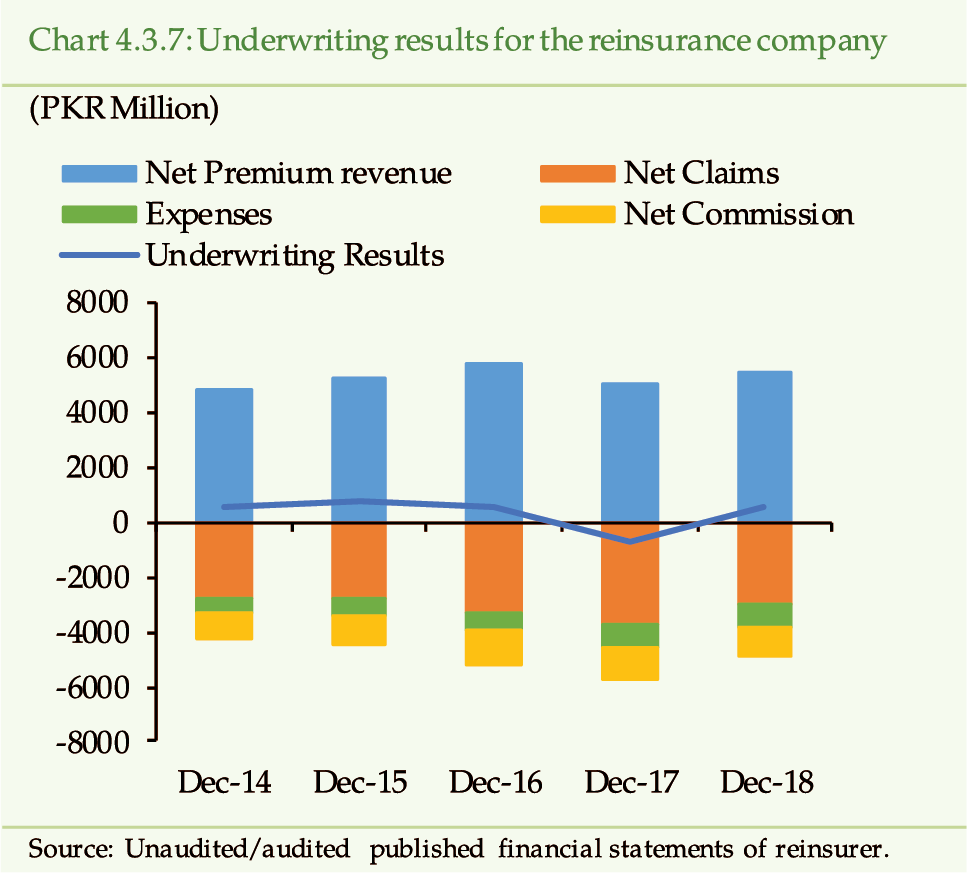
Overall, the non-life sector has ceded reinsurance
worth PKR 35,540 million in CY18 (PKR 32,014 million in CY17). The ratio
of Reinsurance Expense to Net Premium for the non-life sector has remained
stable around 74.73 percent in CY18 (74.7 percent in CY17).
Life insurers have ceded reinsurance worth PKR
2,570 million in CY18, which is up from PKR 2,167 million in CY17. The Premium
Retention ratio of 98.73 percent indicates that the life insurance sector
cedes little reinsurance premium to reinsurers. The associated reinsurance
risk may be mitigated as most life insurers maintain adequate capital and
Statutory Fund balances to absorb losses from a rise in claims or contingencies.
In addition, many private life insurers are part of large corporate groups,
which can help mitigate the risks from unexpected losses. However, some
life insurers still need to improve their underwriting performance.
The
public sector insurer still dominates the life insurance sector…
There are significant public insurers in the life,
non-life and reinsurance sectors of the economy. One public life insurer
still has more than 60 percent share in the asset base of the total insurance
sector while the public non-life insurer (along with a few private non-life
insurers) are significant players in the non-life sector. In order to mitigate
systemic risk, these firms may need to undergo enhanced supervision and
regulation.
Pakistan has witnessed rising volatility in the
domestic financial markets in CY18; this has led to increased market risks
for insurers. This has resulted in insurers increasing their investments
in relatively risk-free categories i.e. government and fixed income securities.
However, the increasing interest rate environment leads to a lower revaluation
of fixed income securities (interest rate risk). Despite this risk, life
insurers tend to invest in long-term government bonds to match the duration
of their policyholders liabilities (to mitigate maturity mismatches).
The economic and geopolitical risk is high which
leads to adverse business conditions, which might impede the growth for
the sector. In addition, the economy is expected to grow at a slower pace
in CY19; this, coupled with the IndiaPakistan border skirmishes in early
2019 indicates that the economic and political risk will remain high in
CY19. The insurance sector is expected to adopt a cautious approach, cut
costs, and improve underwriting performance to mitigate such risks.
In addition, while all life insurers are solvent,
at least five
[9]
non-life insurers do not meet the solvency requirements. One
of these insurers has recently undergone a change in management and may
be able to turn around its position, while another insurer is in the process
of merging its operations with another firm. A few other insolvent insurers
need to prepare and implement viable recovery plans (including improving
their profitability, capital adequacy and solvency margins) or consider
consolidation with other insurers, as they may also not be able to comply
with enhanced regulatory capital requirements.
The
insurance regulator has strengthened the industrys regulatory framework
The Securities and Exchange Commission of Pakistan
(SECP), the insurance regulator, took the following major initiatives
[10]
in CY18 to strengthen the regulatory regime after the issuance
of the Insurance Rules in CY17:
·
Notification of the Credit and Suretyship (Conduct of Business) Rules, 2018
w.r.t. insurance guarantees
·
Amendments to the Insurance Rules, 2017
·
Issuance of Circular on dollar-denominated insurance policies
·
Initiatives taken under the National Financial Inclusion Strategy (NFIS)
e.g. reducing the verification services cost for micro insurance policies
All of these efforts are expected to provide insurers
a conducive environment for growth in the future.
Gross Premiums
are expected to grow at a slightly lower rate in CY19
Going forward, the main drivers of growth include
the increasing purchasing power of the middle class, the use of bancassurance,
Window Takaful Operations, governments health insurance expansion initiatives,
launch of micro-insurance products, etc. Accordingly, the insurance industrys
asset base is expected to expand further in CY19.
As Insurance Premiums and economic growth have
a positive correlation
[11]
, it is expected that Gross Premium will increase at a decelerating
pace in CY19.
The insurance regulators capital requirements
may lead to consolidation in the insurance industry with some insurers expected
to merge or acquire smaller insurers. This is expected to contribute to
the stability of the industry.
The Health segment premiums are expected to receive
a boost as the government plans to expand its National Health Insurance
Program. The Program is also expected to increase the share of dominant
public life insurer in the Health segment as the government will provide
national-level health coverage through the public life insurer; the government
has previously used the public life insurer to launch a similar program
in KPK. In addition, it is expected that overall claims for the public life
insurer (and, in turn, for the life insurance sector) will rise as new business
is underwritten for the Health Insurance Fund, which has a claims ratio
of 83.78 percent in CY18.
[1]
Swiss Re Global economic and insurance outlook 2020
[2]
A wealth management product is an uninsured financial
product (generally offering high rates of return) sold in China by banks
and other financial institutions. They are considered to have financial
stability implications.
[3]
Swiss Re Institute
[4]
The analysis is based on the data of 5 life insurers
and 28 non-life insurers covering approximately 97 percent and 78 percent
of the life and non-life insurance sectors assets, respectively. The analysis
covers data up to period ending December 31 2018. Data has been estimated,
where necessary. The financial close for insurers is December of the corresponding
year. All growth ratios are on year-on-year basis.
[5]
Please see next page for discussion on Surrender Claims
[6]
There is overlap between the statutory funds, as certain
funds in Pakistan have features of two or more different funds.
[7]
This is the first year where separate financials became
available for Window Takaful Operators (WTOs) operating in the Family Takaful
segment. This section covers both WTOs and full-fledged Family Takaful companies.
In the rest of the chapter, WTOs operating in the Family Takaful segment
are included in the consolidated financials of the conventional insurers.
[8]
This section covers both WTOs and full-fledged General
Takaful companies. In the rest of the chapter, WTOs operating in the General
Takaful segment are included in the consolidated financials of the conventional
insurers.
[9]
There may be additional non-life insurers, which are
insolvent. However, nothing concrete can be said about their health, as
these insurers have not shared their financial information.
[10]
SECP Annual Report 2018
[11]
Rudolf (2000), The S-Curve Relation between per-capita
income and Insurance
4.4 Performance and Risk Analysis of Exchange Companies
The performance of the Exchange Companies (ECs)on
the back of healthy expansion in asset and improved incomehas remained
encouraging during FY18. The growing demand for US dollars and rising kerb
premium has resulted in an uptrend in foreign currencies exports. The role
of ECs remains limited in facilitating inward remittances. SBP is strengthening
the AML/CFT regime of Exchange Companies to mitigate the associated risks.
Besides, major challenges faced by ECs relate to operational constraints
emanating from uninsured cash and limited adoption of technology-based business
applications. However, owing to their small size and limited interconnectedness
with the banking sector, the ECs do not represent a possible source of systemic
risk, though reputational risk remains.
There is synchronized upturn in assets and income during FY18
The asset base of the Exchange Companies (ECs)
has risen by 17.56 percent during FY18up from 10.70 percent in FY17, primarily
on account of rising fixed assets (branch expansion) and appreciation of
USD, supported by 7.73 percent increase in paid-up capital.
[1]
In addition, the Return on Equity (RoE) has almost doubled to
8.65 percent during FY18 from 4.48 percent a year earlier.
[2]
Resultantly, the expenses to income ratio has declined,
indicating improved operational viability (Chart 4.4.1).
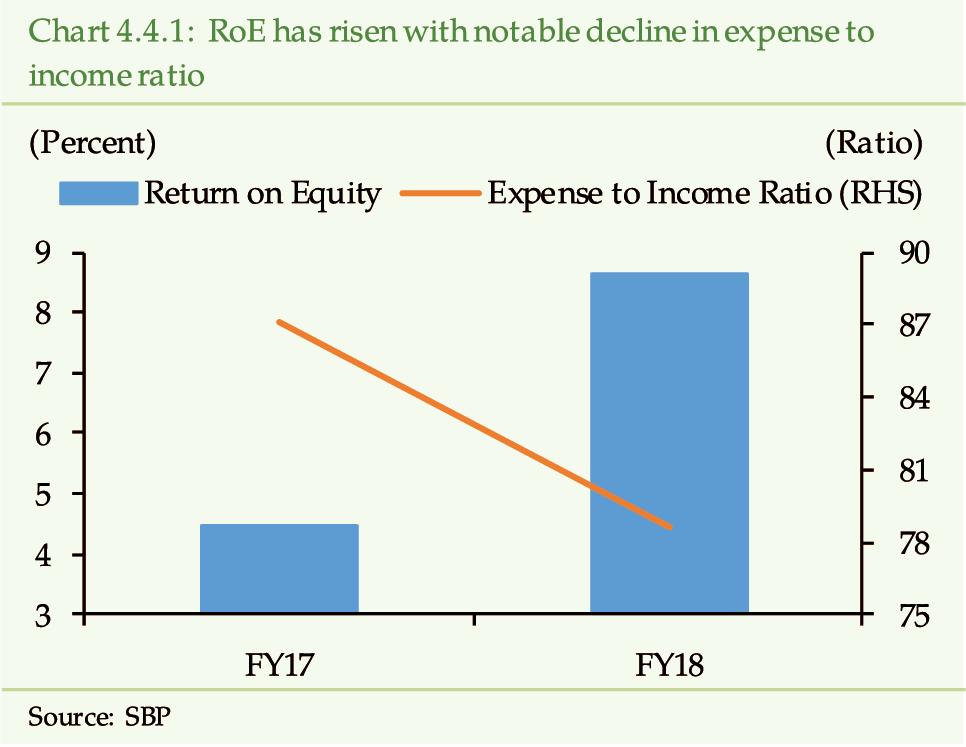
Income
of ECs rises as dealings in FCY surges
Selling foreign currencies (FCY)that are in high
demandin the domestic market is a major source of income for ECs. Since
US dollar commands highest demand in the domestic market, ECs profit through
its sale-purchase transactions. They also benefit from export of FCYs that
have low domestic demand.
[3]
In FY18, ECs have exported USD 2,479.0 million
worth of foreign currenciesup from USD 1,897.0 million in FY17. They have
exported another USD 1,316 million worth of FCYs during H2CY18. These exports
increase the supply of US dollar with the ECs, allowing them to do more
sale-purchase transactions.
The rising external account vulnerabilitiesin
the backdrop of falling SBP forex reserveshave led to an increased volatility
in the open market exchange rate and higher kerb premium (the difference
between open market and inter-bank exchange rates). Rising kerb premium
seems to be one of the reasons behind increased purchases from individuals
of foreign currencies other than US dollars
[4]
, which, in turn, have pushed up their exports. (Chart 4.4.2)
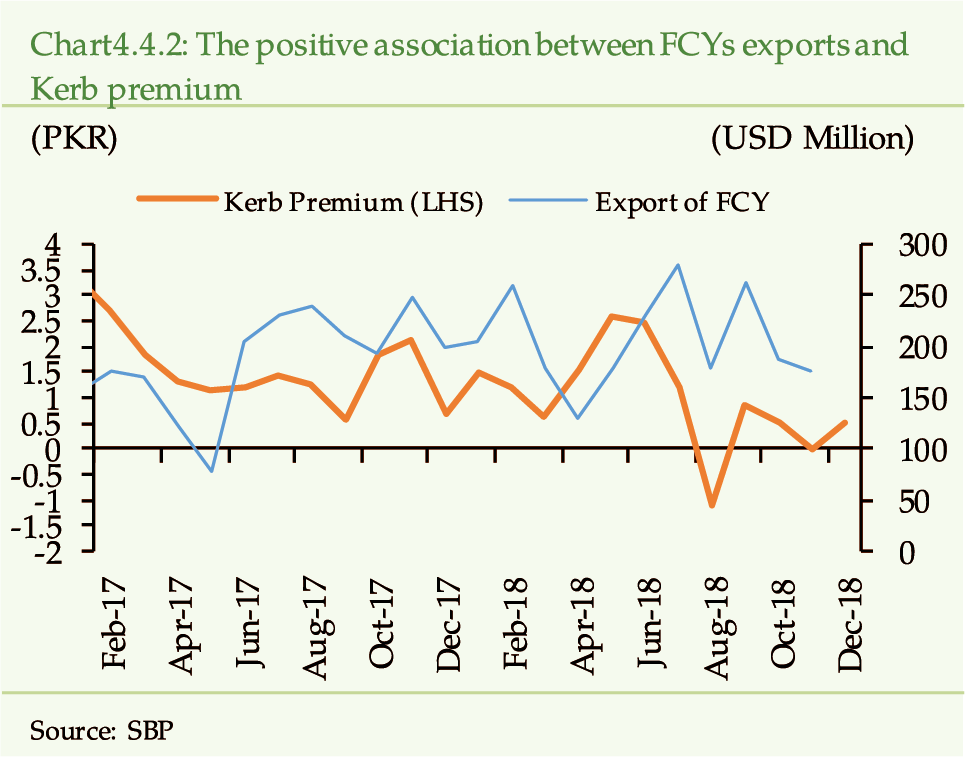
The
inward remittances rise while the outward remittances contract
In CY18, inward remittances received through ECs
have accelerated by 8.35 percent (USD 1,328 million)up from 1.50 percent
(USD 1,225 million) in the previous year. Moreover, in CY18, the inward
remittances through ECs has accounted for 6.98 percent (on average) of the
total inward remittancesslightly up from 6.73 percent in CY17. The ECs
have channeled 7 percent of the total inward remittances in the last 4 years
(Chart 4.4.3). Increased remittances inflow is due to additional bilateral
arrangements of ECs with overseas tie-ups. Positively, it might have helped
ease some dollar liquidity pressures witnessed during the reviewed year.
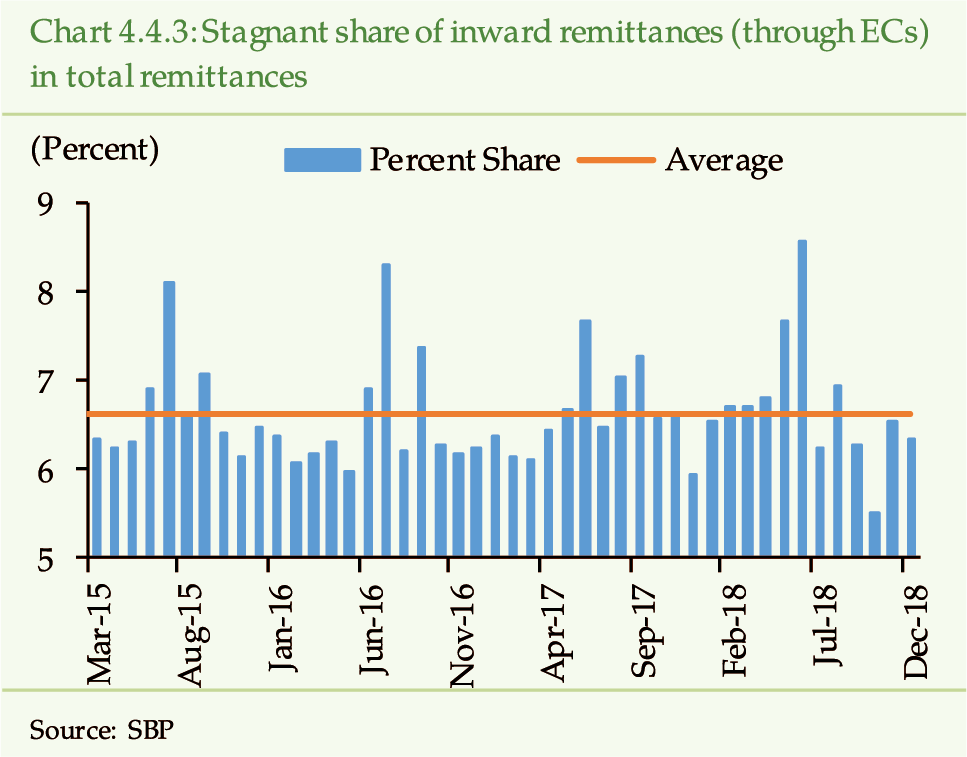
On the contrary, outward remittances show contraction
of 7.74 percent in CY18 against growth of 2.53 percent in CY17. It seems
that PKR depreciation has dampened the outflow of foreign currencies and
served to provide some relief to the forex market. Moreover, the trends
of inward and outward remittances have been diverging (Chart 4.4.4).
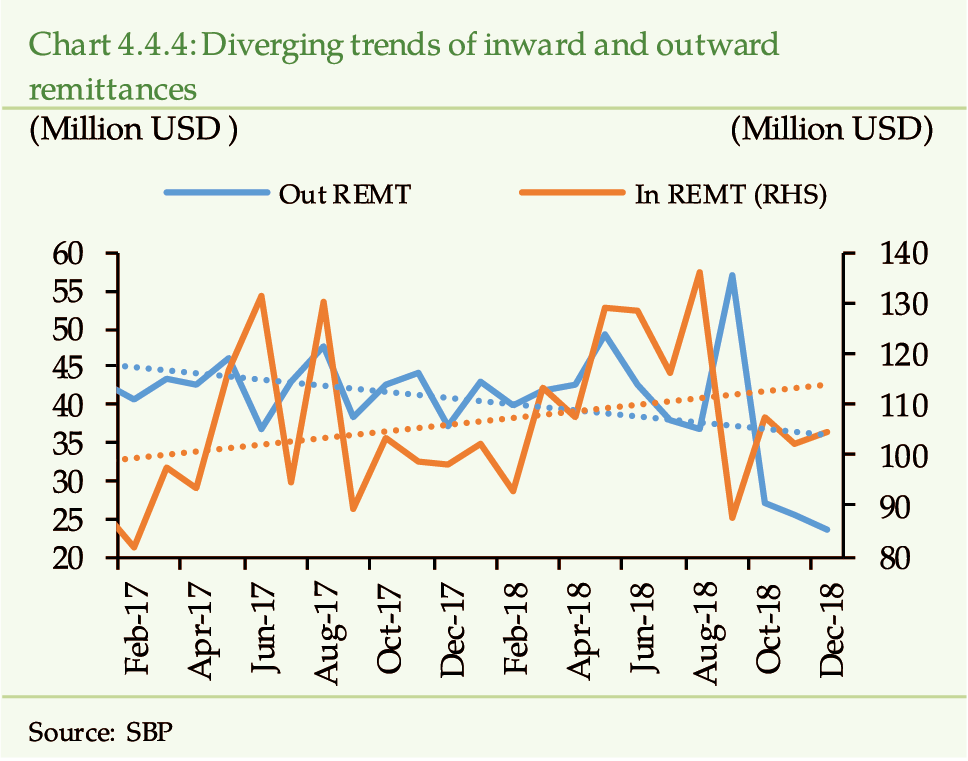
SBPs
regulatory regime relating to ECs addresses the risks of money laundering
and financing of terrorism
SBP, in order to mitigate the ML/FT risk, has put
in place a comprehensive regulatory and supervisory framework, which is
collected in the form of an ECs Manual.
[5]
SBP has introduced various new measures during
CY18. To enhance the documentation of transactions, exchange companies have
been directed to retain copies of identification documents for all foreign
currency transactions equivalent to USD 500/- or above.
[6]
In order to further strengthen the regulatory AML/CFT requirements,
exchange companies have been required to record the inland movement of foreign
currencies within their authorized branch network.
[7]
Also, instructions have been issued under UNSC
resolutions and Anti-Terrorism Act, 1997 to ensure proper screening of proscribed
entities and individuals.
[8]
Moreover, regular on-site inspections are also conducted
by SBP to warrant its enforcement.
Uninsured
cash and limited adoption of tech-based business applications may raise
operational risk
Cash constitutes a sizeable portion of exchange
companies assets. Being a risky asset, prone to theft or destruction, uninsured
cash poses a key operational risk. Owing to their small size and inherently
high risk of dealing in cash, the cost of insurance becomes unfeasible leaving
them vulnerable to asset losses.
With a view to improving the operational risk management,
the mechanism for monitoring through Close Circuit Television (CCTV) cameras
installed at company outlets has been standardized by SBP. Resultantly,
the improved surveillance will not only minimize the operational risk but
will also strengthen supervisory oversight of SBP.
[9]
Furthermore, the level of adoption and sophistication
of technology-based solutions remains low, due to inadequate investment
in related technology infrastructure and human resources.
however,
systemic risk remains contained
In aggregate, the exchange companies sector is
characterized by small balance sheet size and limited inter-connectedness
with the banking sector. The overall share of ECs in the total assets of
the financial sector stands at 0.06 percent as of end June-2018. Similarly,
only two ECs are operated by banks as their subsidiaries, which manifests
limited exposure of the banking sector, though reputational risk remains.
All-in-all, the risk from ECs may not be systemic in nature.
Minimizing
operational risk and improving governance are key priority areas for ECs
Going forward, the focus of the exchange companies
must be on limiting operational risk. Improvement in operations will not
only expand their customer base but will also aid in achieving a stabilized
exchange rate, through efficient management of supply of foreign exchange.
Moreover, employment of technology-based governance applications will also
support them in mitigating the risk of non-compliance with relevant regulations
and laws.
[1]
The ECs assets comprise of Cash, fixed assets and
intangible assets. The balance sheet data is available up to June 2018 (FY18).
[2]
Total income has risen by 38.55 percent in FY18 against
17.89 percent in FY17.
[3]
Exchange Companies (only A category) are permitted to export
foreign currenciesexcept for the US dollarthat are domestically not in
demand and bring in equivalent US dollar in form of cash and through their
FCAs maintained with banks in Pakistan. However, ECs are directed to sale
at least 10 percent of the proceeds from export of FCYs in interbank market
on an ongoing basis.
[4]
Rising kerb premium incentivizes non-resident Pakistanis to bring
home foreign currencies and convert them into PKR at a better exchange rate.
[5]
ECs Manual 2018 lays out a robust set of guidelines
covering areas such as documentation of transactions, Know Your Customer/
Customer Due Diligence (KYC/CDD) measures, identification of beneficial
ownership, reporting of suspicious transactions/currency transaction reports,
record-keeping and capacity building of human resource etc.
[6]
EPD Circular Letter No. 08 of 2018;
http://www.sbp.org.pk/epd/2018/FECL8.htm
[7]
FE Circular No. 05 of 2018;
http://www.sbp.org.pk/epd/2018/FEC5.htm
[8]
FE Circular No. 09 of 2018;
http://www.sbp.org.pk/epd/2018/FEC9.htm
[9]
FE Circular No. 15 of 2018;
http://www.sbp.org.pk/epd/2018/FEC15.htm
Section C: Non-Financial Sector
5 Performance and Risk Analysis of the Corporate Sector
The tighter macro-financial
conditions and uncertainty about future economic prospects has dampened
the performance of the corporate sector. The asset base shows growth, while
sales growth decelerates and the profitability, liquidity and operational
efficiency indicators trend downwards. Disaggregated analysis highlights
that operational efficiency indicators of cement and power sectors face
major contraction. The investors perception about the corporate sector
has also weakened as illustrated by the decline in equity market and leading
market indicators. However, the key financial and performance indicators
remain in a comfortable range. The concerted efforts of the policy makers,
however, may further improve the environment related to ease of doing business.
The
interconnectedness remains strong between the corporates and the banking
sector
In Pakistan, financial institutions (banks and
DFIs) are the key source of financing for the corporate sector, as the capital
market depth remains limited. Lending to corporations constitutes 71 percent
of banks and DFIs domestic advances portfolio as of end CY18 (Chart
5.1, Chapter 3.1 and Chapter 4.1). As such, strong interconnectedness
exists between the two sectors, thus, a shock in any one of them can adversely
affect the operating performance and solvency of the other.
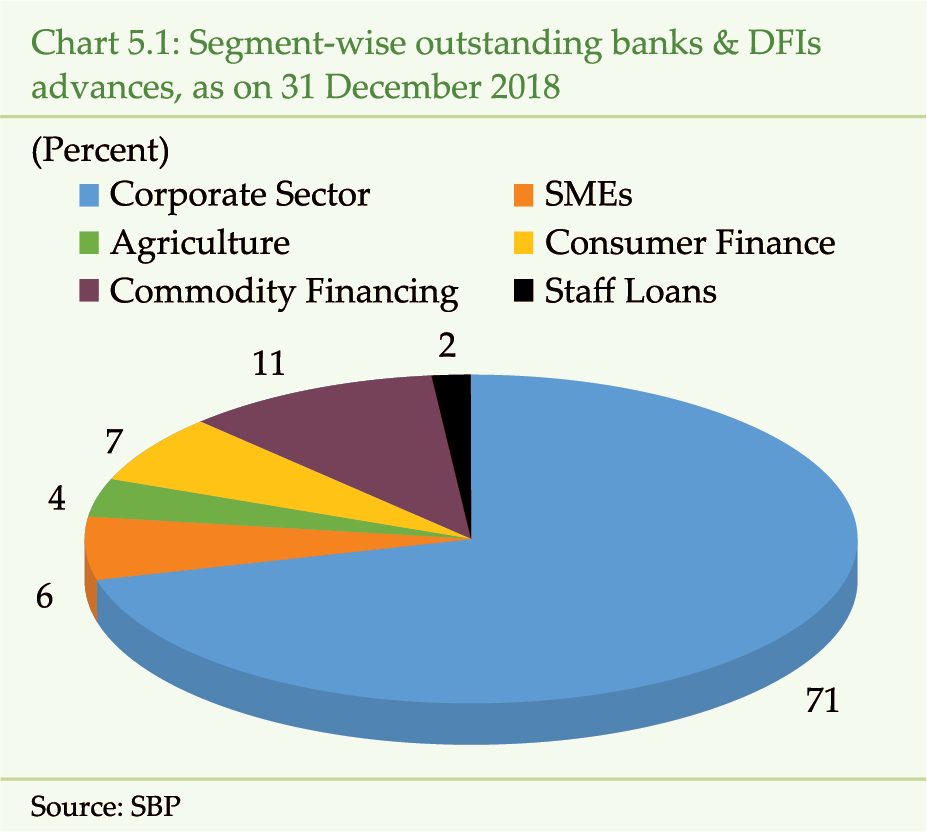
Corporate
sectors performance dipped in CY18 in the wake of challenging macroeconomic
environment
The increase in the interest rate from 5.75 percent
in CY17 to 10 percent by end CY18 has jacked up the financial cost for the
corporates across the board contributing to the fall in profitability (Chapter
1). Exchange rate depreciation, on the other hand, has had
mixed impact on the performance of the firms. It has caused a hike in the
cost of production of corporations that rely on imported components, while
export-oriented firms may have benefited in terms of price competiveness
in the international markets.
Overall, the assessment indicates signs of slackening
in the operating performance and financial strength of corporates (Table
5.1).
[1]
The pro-forma financial statements (covering 84.17
percent of total assets of listed companies) indicate that the gearing and
leverage of the corporates have inched up.
[2]
Whereas, the liquidity indicators, along with debt repayment
capacity and profitability, have depicted a slight decline.
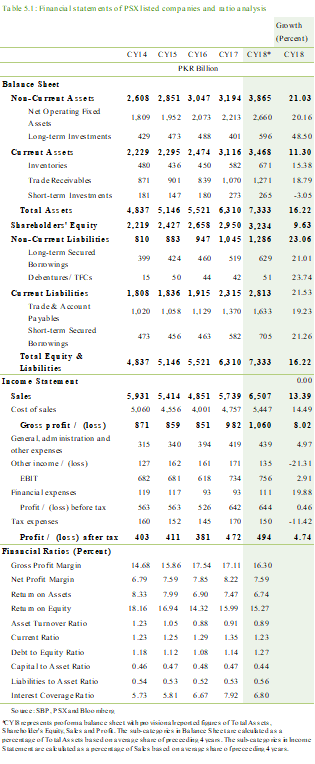
Corporate sectors reliance on borrowings for
growth and liquidity rises
The asset base of the corporate sector has observed
16.22 percent growth in CY18 at the expense of increased leverage. The growth
has largely been contributed by operating fixed assets, which have been
growing in line with the capacity enhancement in a number of sectors. Long-term
lending by financial institutions, comprising 45.21 percent of total lending
to the corporate sector, experienced a growth of 18.16 percent in CY18.
Consequently, the corporate entities have witnessed increase in their gearing
and leverage. A 23.06 percent growth in non-current liabilities has been
recorded in CY18, which is greater than preceding three years average growth
of 8.86 percent
Moreover, the key liquidity indicator i.e. current ratio has contracted from 1.35 in CY17 to 1.23 in CY18. The current liabilities, mainly because of short-term borrowings, have witnessed faster growth compared to current assets (Chart 5.2). The accelerated 38.76 percent YoY growth (19.77 percent in CY17) in financial institutions lending for working capital further substantiates this phenomenon.
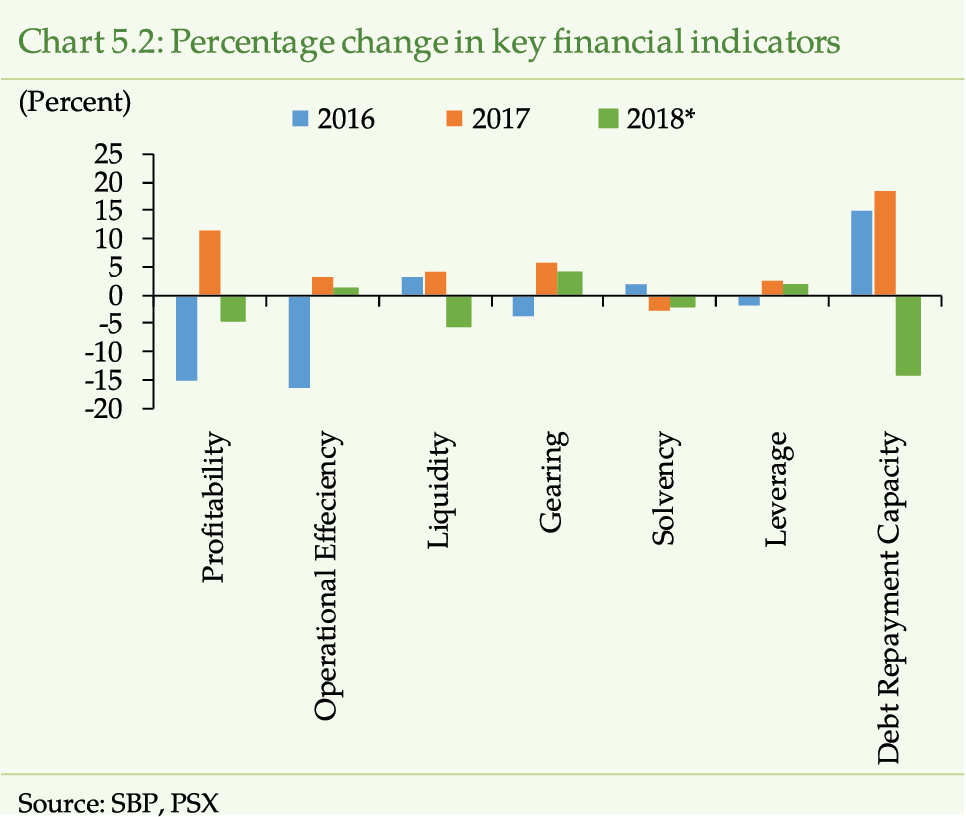
and
the sales growth decelerates
During the year under review, the sales growth
decelerates to 13.39 percent (18.29 percent in CY17), as rising inflation
and a challenging economic outlook affected both the purchasing power as
well as the spending activities in the economy. Simultaneously, the cost
of sales has also risen. Cumulatively, they have had a major impact on the
profitability of the corporates as reflected by a subdued growth in operating
profit that stands at 2.91 percent in CY18, against 18.75 percent in CY17.
Despite
some drop, the debt repayment capacity remains comfortable
The debt repayment capacity of the corporate sector
has somewhat softened in CY18 as the interest rate has spiked and sectors
leverage has further risen. Besides the inch up in the debt to equity ratio,
the interest coverage ratio has deteriorated from 7.92 in CY17 to 6.80 in
CY18. However, these indicators still seem better than what they used to
be a few years back.
Financial
leverage has supported the profitability, however, it entails risks
Among the profitability indicators, the base line
indicator ROE has decreased from 15.99 percent in CY17 to 15.27 percent
in CY18 (Chart 5.3). The Extended DuPont analysis reveals that ROE
has declined in CY18 due to increase in interest burden. Besides, decline
in operating profit margin and asset usage efficiency further contributes
towards the contraction in ROE (Table 5.2).
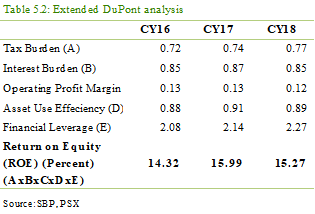
On the contrary, drop in the corporate tax rate
from 31 percent (CY17) to 30 percent in CY18 has reduced the tax burden
of corporates.
[3]
Similarly, increase in the financial leverage supported the ROE
as it has absorbed a part of the dampening impact coming from weakening
operating performance and rising interest rate burden.
[4]
The use of borrowing to support the declining liquidity and profitability
is not sustainable. This is because after surpassing a certain threshold,
the interest burden will supersede the benefits from the financial leverage.
Thus, the increased financial leverage will entail risks in terms of solvency,
gearing and debt repayment capacity.
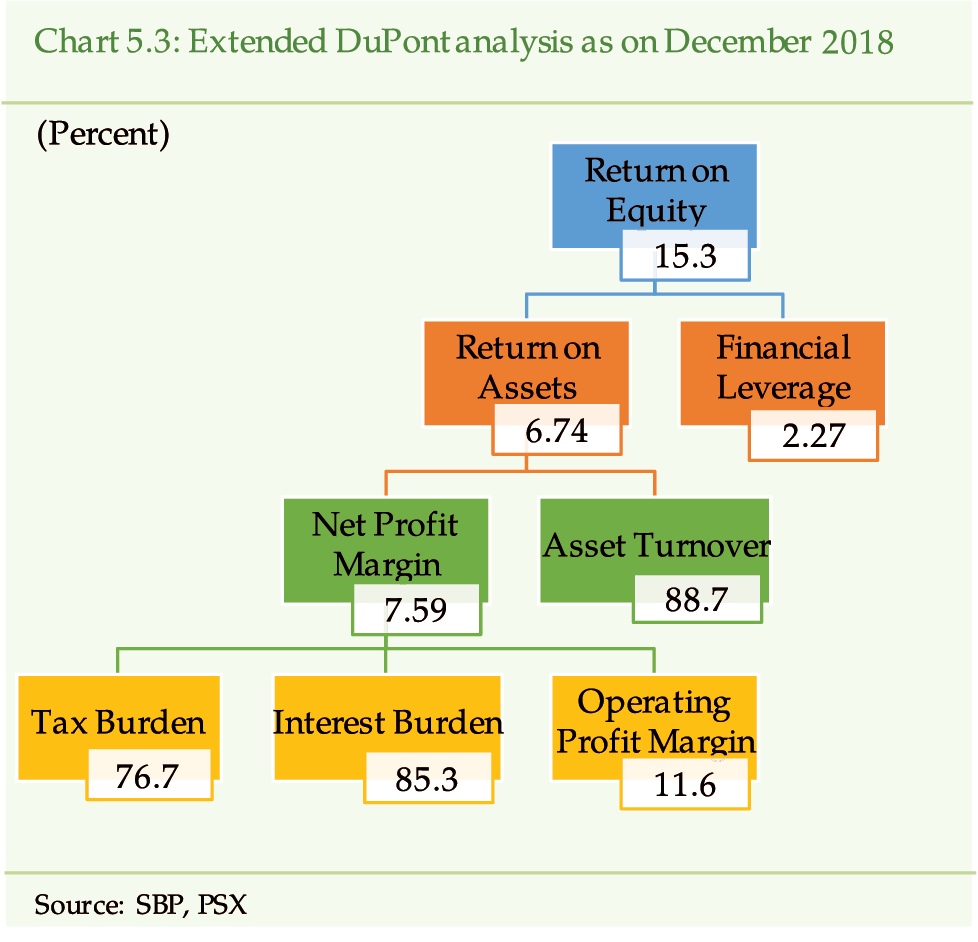
KSE-100
index reflects the weakened market perception regarding the corporate sector
The slacking operating performance of the corporates
is also reflected in the downward movement as well as high volatility of
the KSE-100 Index in CY18 (Chart 5.4). During CY18, the KSE-100 index
after touching a reviewed years peak of 46,580 points in April 2018 has
declined to 37,067 points that translates to a dip of 20.4 percent. During
the same period, the P/E ratio has dipped to 8.9 from 10.8, illustrating
a decline of 17.59 percent. The reduced valuation reflects a general decline
in investors confidence about the operating performance and future prospects
of the corporates (See Chapter 2).
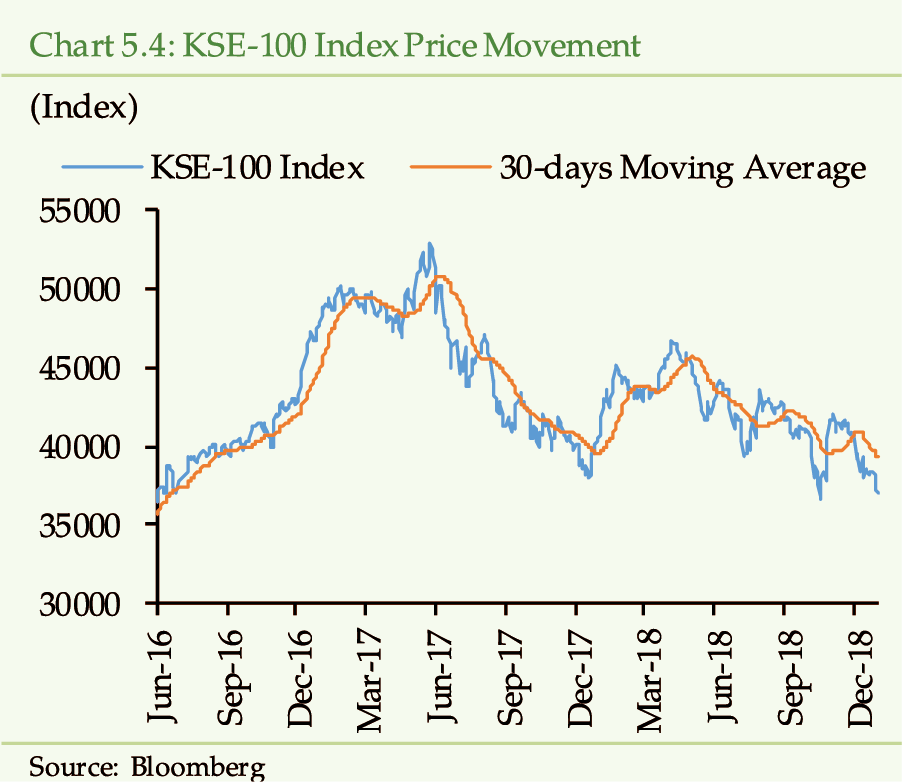
The sector-wise analysis reveals mixed performance
Macroeconomic stress has directly affected the
sales performance of corporate entities in various sectors. The cement and
power sectors experienced negative sales growth. Whereas, the oil &
gas sector, along with textiles and automobiles have enjoyed the positive
sales growth (Chart 5.5). Cumulatively, these three sector comprise
of 66.9 percent of the aggregate corporate sector sales in CY18. Comparatively,
last year all sectors experienced a positive sales growth. Power, food and
textile sectors turned out to be the most leveraged sectors in comparison
to other sectors and they lag in liquidity and operating performance indicators.
Rising
input costs and lower demand pulls down the cement sector
Cement sectors financial and operational performance
has declined in CY18, mainly due to, rising input costs (rise in coal and
fuel prices) and reduction in demand (as fiscal constraints have led to
a reduction in Public Sector Development Program (PSDP)). As a result, the
revenues of the cement sector have declined by 10.26 percent. The positive
aspect for the sector is the growth in exports, which have increased by
36 percent.
[5]
The exchange rate adjustment has supported the competitiveness
of the sector; however, exports at present are only a nominal part of the
aggregate cement sales. The outlook for the cement sector is positive in
the context of material developments regarding Mohmand and Diamer-Bhasha
dams and an expected pick-up in construction and housing activities.
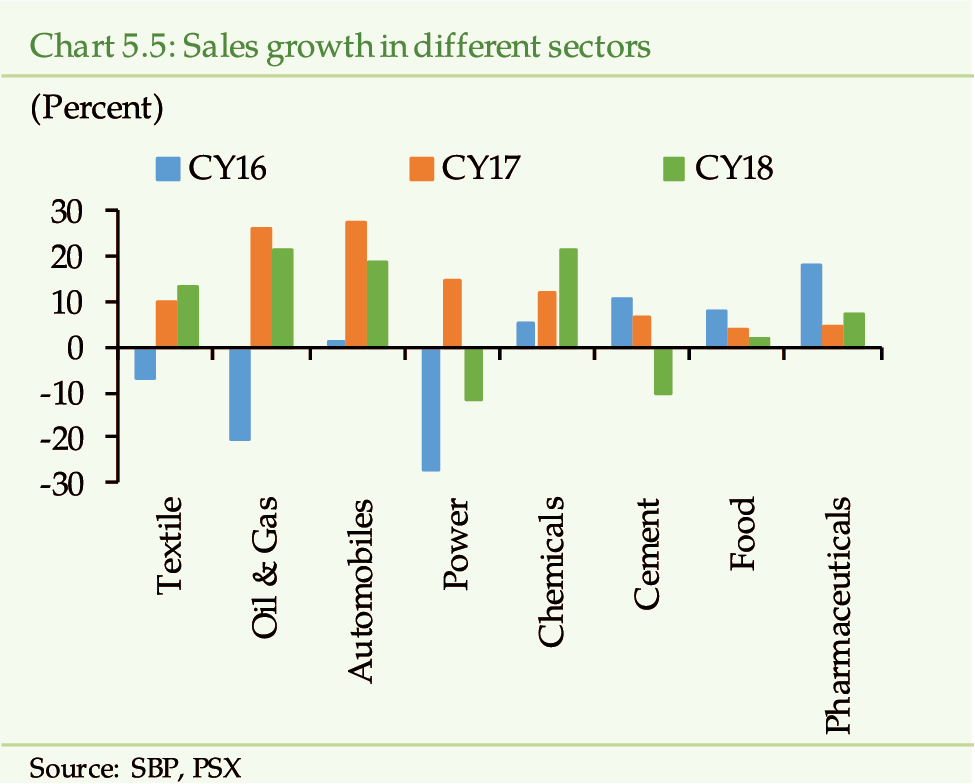
Power sector is burdened with the circular
debt
Power sectors performance has slowed down during
this year. The sales have decreased by 11.49 percent on year-on-year basis,
mainly due to lower power generation during the year.
[6]
Primary risk faced by the power sector is the accumulation of
circular debt mainly due to incomplete recovery of electricity bills and
increasing transmission and distribution losses. However, the government
is taking measures to curb the levels of circular debt by banning furnace
oil imports, increasing the energy prices and moving towards coal and RLNG
power generation.
Oil
& Gas, the leading sector, performs better in CY18
Oil & Gas is the leading sector in terms of
both market capitalization as well as the quantum of borrowings from the
banking sector. In CY18, its profitability has improved primarily due to
the rise in sales by 21.39 percent. However, it has faced higher financial
charges due to magnitude of its borrowings coupled with monetary policy
tightening during the year under review. Moreover, most of the refineries
are in an expansion phase and require funding to keep the work flowing.
During the year under review, this sub-sector effectively weathered some
pressures i.e. devaluation of the currency, exchange rate losses and slowdown
in economic activity. Going forward, the performance of this sub-sector
will largely depend on the demand and prices of automobile fuel. Moreover,
the general abolishment of the Super Tax will have positive impact on the
sector.
[7]
Textile
sector stands at the bottom in terms of profitability and liquidity
The textile sector has recorded the lowest profitability
amongst all sectors, though it has improved in CY18 (Chart 5.6).
Although, devaluation of the currency has made textile exports competitive
and the governments incentive to provide uniform gas prices has helped
profitability, the dependency on imported cotton, imported machinery and
aggressive competition in value-added segment from Bangladesh and Vietnam
confines the textile sectors revenues and margins.
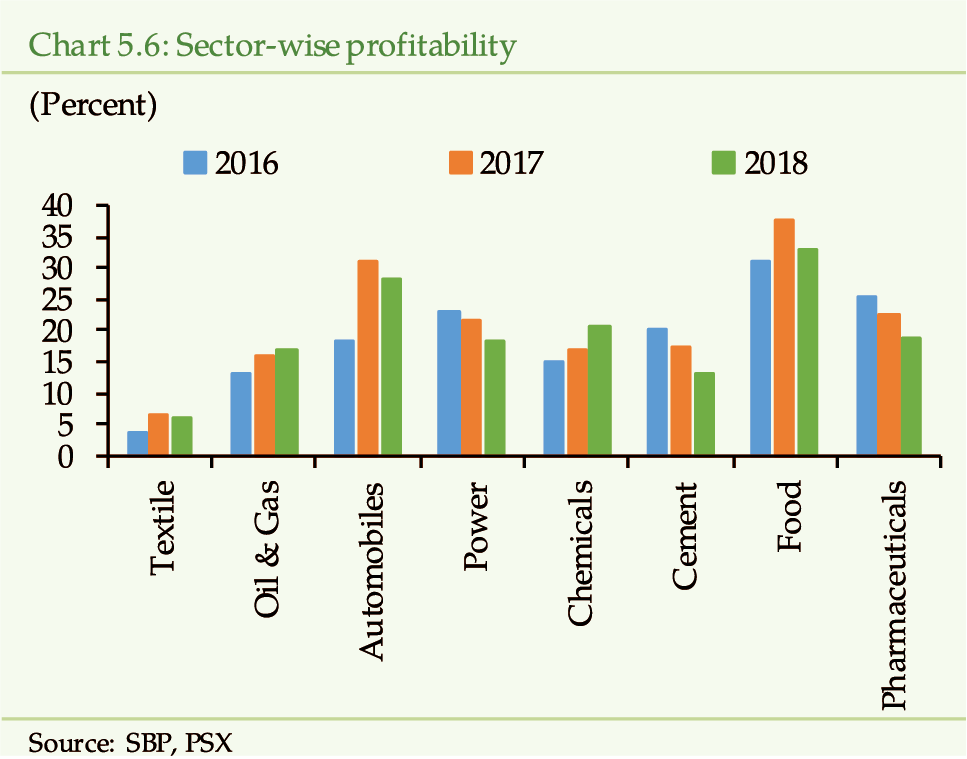
The outlook may improve if the government targets
higher cotton production as the currency devaluation has made imported cotton
less competitive in the local market. Nevertheless, some challenges need
to be addressed that include improvement in product quality and research
and development.
Automobiles
sectors high performance is expected to attract capacity enhancement in
coming years
Automobile sector has the highest operational efficiency
in the corporate sector. It has, however, faced a contraction in the gross
profit margin in CY18, as the bar on non-filers against purchase of new
car affected the demand and the devaluation of the currency put pressure
on production costs and profit margins. Resultantly, local assemblers increased
their prices to sustain profitability. The outlook is positive in terms
of enhanced production capacity as Kia, Hyundai and Renault are expected
to enter the market in the coming years. Further, the enhancement of federal
excise duty (FED) on imported vehicles could increase the demand for locally
assembled vehicles. However, because of increase in FED on the imported
parts, automobile assemblers, who mostly rely on imported components, might
be negatively affected.
[8]
Altman
Z-Score highlights the growing credit risk in some of the key sectors
The slowdown in economic activity and the challenging
macroeconomic environment have dented the business operations and performance
of corporate entities. The increased volatility and a general decline in
stock prices negatively affected the fair market value of firms and weakened
their financial position in terms of the solvency cushion. These developments
also reflect a general decline in these firms weighted average Altman Z-score
that is used to assess the firms financial health and likelihood of failure.
In CY18, the sub-sectors including textiles, cement
and power faced the greatest decrease in the market value. Thus, they are
ranked lowest on the Altmans z-score model. The credit worthiness of the
other sub-sectors also decreased as their Z-score contracted; however, they
are still within the safe range. (For details please refer to Box 5
which discusses the overview of Altman Z-Score model and detailed assessment
of Pakistans corporate sector on this model.)
Probability
of default (PD) has observed some increase for most of the sectors
The weighted average PD of corporate sector, from
CY16 to CY18, depicts an increasing trend, for both 1 year and 5 year horizon
(Chart 5.7).
[9]
In CY18, weighted average PD of the corporate sector stands at
0.03 percent and 0.21 percent for 1 year and 5 year respectively. The disaggregated
assessment indicates that textile sector has the highest PD, in CY18, for
both 1 year and 5 year, 0.98 percent and 4.31 percent, respectively. Given
the adverse economic and political factors, the trend of 1 year PD has increased
for all the sectors, except chemicals and oil & gas sectors (Chart
5.8). Similar trend also appears in the 5 year PD.
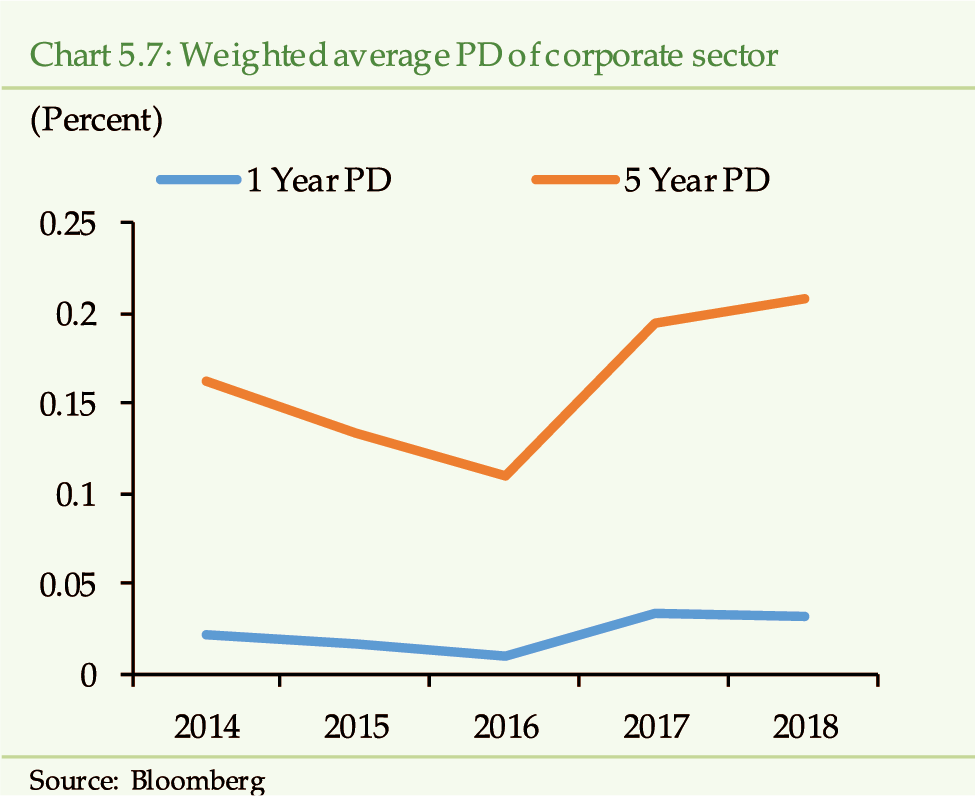
The trend of PD supports the findings of the Altmans
Z-score as both models estimate increasing PD due to the weakening and increased
volatility in firms market value. The softening of financial and operating
profit indicators have somewhat contracted the solvency cushion and contributed
indirectly to the volatility of the market value of the firms. Therefore,
the lower market valuation, besides sentiments of the investors, is also
being driven by weaker fundamentals.
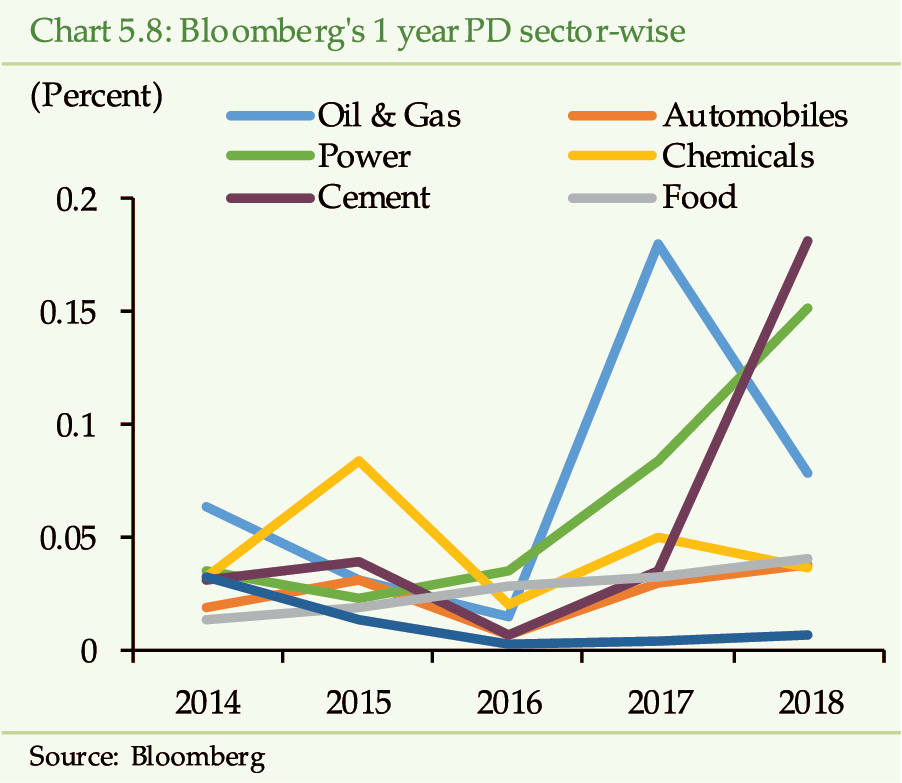
Credit risk ratings culture, though not wide
spread, shows improvement
Besides financial health, the ability of the entities
to honor their financial obligations can be gauged by their credit risk
ratings. However, the rating culture in Pakistan is not wide spread, as
a major portion of entities remain unrated. Out of the selected sample of
listed entities, only 31.68 percent of them were rated in CY18. However,
the rating culture showed improvement as in CY17 only 18.15 percent of the
sampled entities were rated (See Chapter 3.1).
It is generally the case that well performing corporate
entities get themselves rated and mediocre performing entities avoid being
rated. The inherent nature of bank-dominated finance and costs associated
with the ratings discourages the companies to get themselves rated.
[10]
However, going forward, considering the dynamics of international
and domestic regulatory environment, ratings could gain more traction.
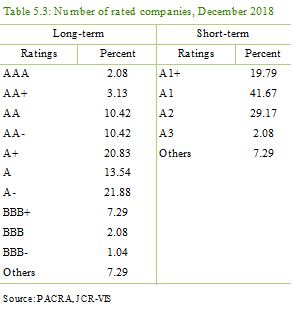
Out of rated entities, major chunk of the companies
lie in high credit quality cluster in terms of long-term ratings, which
includes ratings of A+,A and A- (Table 5.3). Whereas, in terms of
short-term ratings, majority of the companies are rated as A1 that is strong
capacity for timely repayment.
[11]
Ease
of Doing Business ranking has improved
An enabling business environment stimulates the
growth of entrepreneurship in a country. The ease of doing business index,
issued by World Bank, measures the extent to which the policy and regulatory
frameworks support the ease of doing business. According to the World Banks
latest report, Pakistan has improved its ranking from 147 to 136 out of
190 countries in 2019.
[12]
. Noticeably, the improvement in the ranking has come on the back
of score improvement in different indicators of the doing business index.
The major three indicators, which have witnessed significant improvement
in scores included, resolving insolvency (from 45.8 to 59.9), starting a
business (from 76.6 to 81.9), and registering a property (from 41.3 to 45.6)
and (Chart 5.9). Some other areas where the score has improved are
dealing with construction permits, getting electricity and paying taxes.
The resolving insolvency score has improved due to the introduction of reorganization
procedures and improvement in continuation of the debtors business during
insolvency proceedings.
[13]
Likewise, enhancement of online one-stop registration system
by Government of Pakistan has aided the starting a business segment. Fundamentally,
several forms for incorporation of a business have been replaced with a
single application and information sharing between registry and tax authorities
have been introduced.
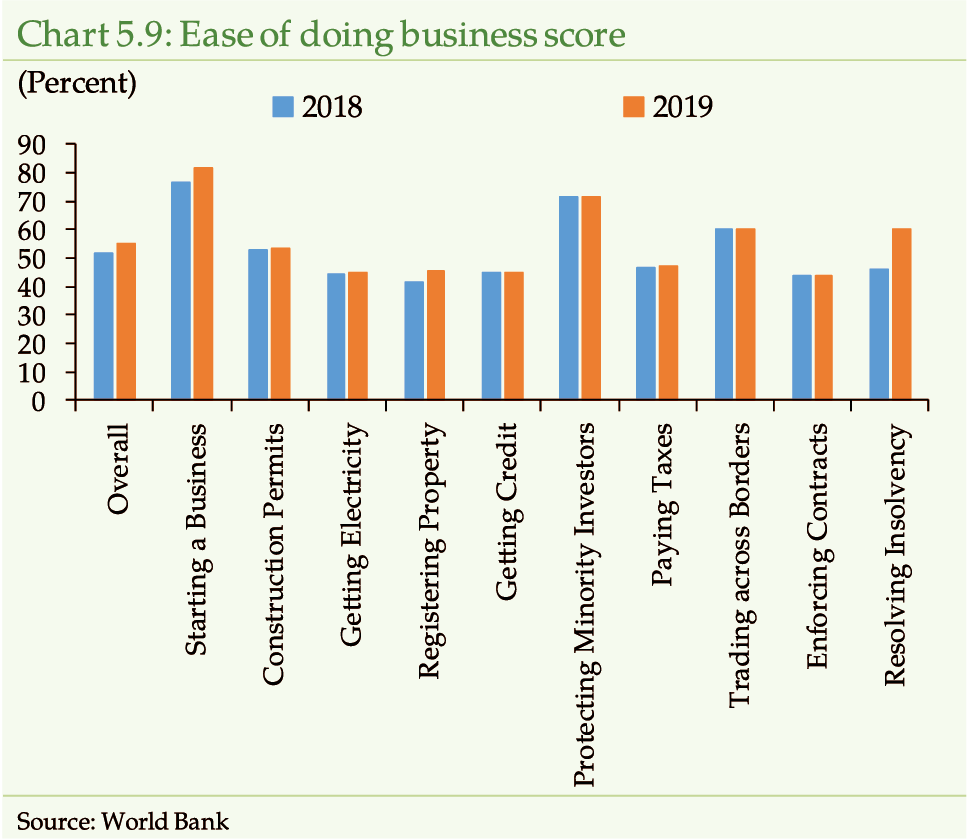
Although the ease of doing business score, which
forms the basis of the ranking, has improved to 55.31, it is still below
the South Asian regional average score of 56.71. In order to improve the
score and, therefore, the rankings, substantial reforms, under various indicators,
at both the provincial and federal levels need to be accelerated. For instance,
development of a new container terminal and enhancing the customs platform
i.e. National Single Window for electronic document submission will help
in improving our score in the trading across borders indicator.
[14]
Outlook
for the corporate sector is positive
The performance of the corporate sector in the
coming year is dependent upon various factors.
Improvement in the macroeconomic conditions, especially
the current and fiscal account deficits are necessary for economic stability.
The government is enthusiastically endeavoring to overcome these economic
challenges. It is expected that further positive developments and the conclusion
of the agreement on IMF program could subside these challenges and pave
the way for strong growth in the future.
In the short run, the IMF Program might accelerate
inflation and subside the growth in the economy; however, in the long-run,
it may stabilize the growth in the economy and restore investors confidence
in the equity and forex markets.
Furthermore, the abolishment of the Super Tax on
the non-banking companies and reduction of corporate tax rate in the coming
years can augment the performance of the corporate sector. However, imposition
of any additional taxes could impede the performance of the corporate sector.
Additionally, under the umbrella of CPEC, some
initiatives have been taken to develop special economic zones to promote
the collaboration of Chinese and local industries. The development of the
Gwadar port with the aim of transforming it into a trade hub could also
open up business opportunities. These developments can potentially contribute
positively to the economy and the corporate sector of Pakistan.
Box 6: Altman Z-score Measure of distress
The Altman Z-score is a statistically driven empirical model that is, generally used to assess the health of firms. Particularly, it measures the liquidity conditions as well as predicts the probability of insolvency and financial distress.
The Altman Z-score is derived
from several key ratios that measure different key aspects of a corporate
entitys financial health and performance. The score consists of five variables:
X1 = Working Capital /
Total Assets
X2 = Retained Earnings / Total Assets
X3 = EBIT / Total Assets
X4 = Market Value of Equity / Total Liabilities
X5 = Net Sales / Total Assets
The Z-score is calculated
by the following formula
[15]
,
[16]
:
Z = 1.2*X1 + 1.4*X2 + 3.3*X3
+ 0.6*X4 + 0.999*X5
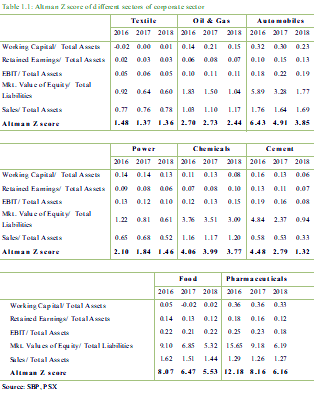
To apply the model on
the corporate sector of Pakistan, 303 listed companies are selected as a
sample. These corporations are categorized into eight sectors, namely, textile,
oil & gas, chemicals, power, cement, automobiles, foods, and pharmaceuticals.
Based on the individual scores of these selected firms, the aggregate weighted-average
scores of all sectors have been calculated for the last three years (Table
1.1).
In line with slowdown
in economic activity and contracting market value of corporate entities
that prevailed during the year under review, the weighted average Z-score
of all the sectors declined in CY18 as
compared with the previous years assessment. Noteworthy sectors highlighted
by the Z-score are textile, power and cement. The scores of these sectors
fall in the lower ranges, which as per the original Z-score model are considered
distress zone. This urges rigorous measures for improving the financial
position of firms. All the remaining sectors are placed in the safe zone
except for the oil & gas sector, who fell in the grey zone and skewed
towards the safe zone (Chart 1.1).
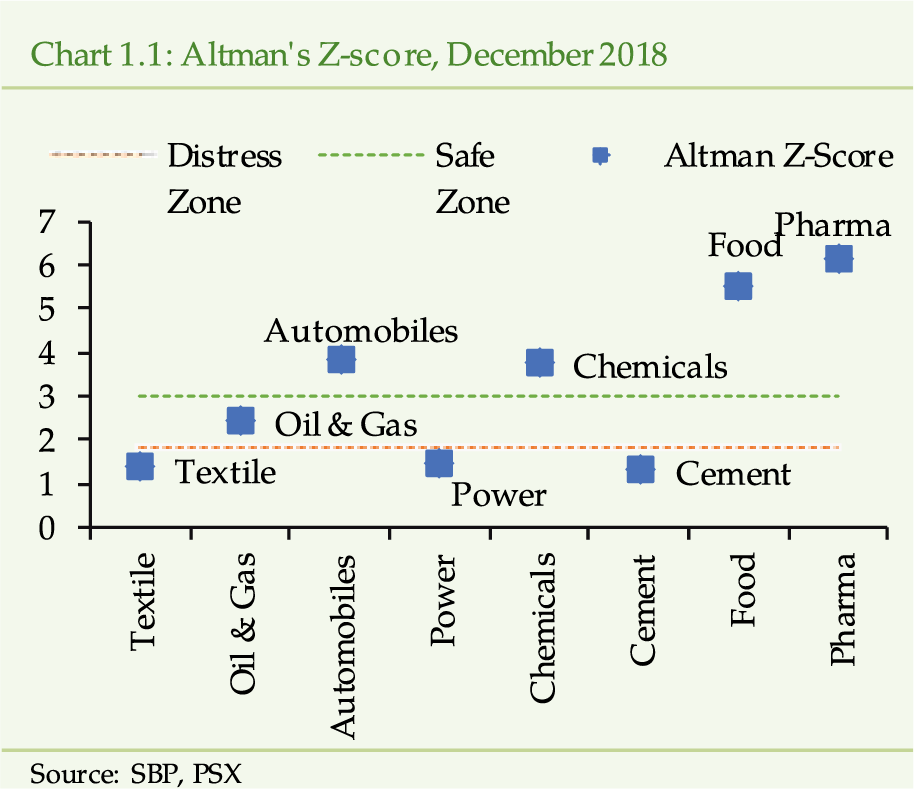
Taking into account the
Z-score of the preceding years, the textile sector continually stays in
the distress zone and oil & gas sector stays in the grey zone. Whereas,
the power sector that is on the borderline of distress zone for the last
two years, demoted into the distress zone in CY18. Following similar footsteps,
the cement sector started to decline from the safe zone in CY16 into the
distress zone in CY18 (Chart 1.2).
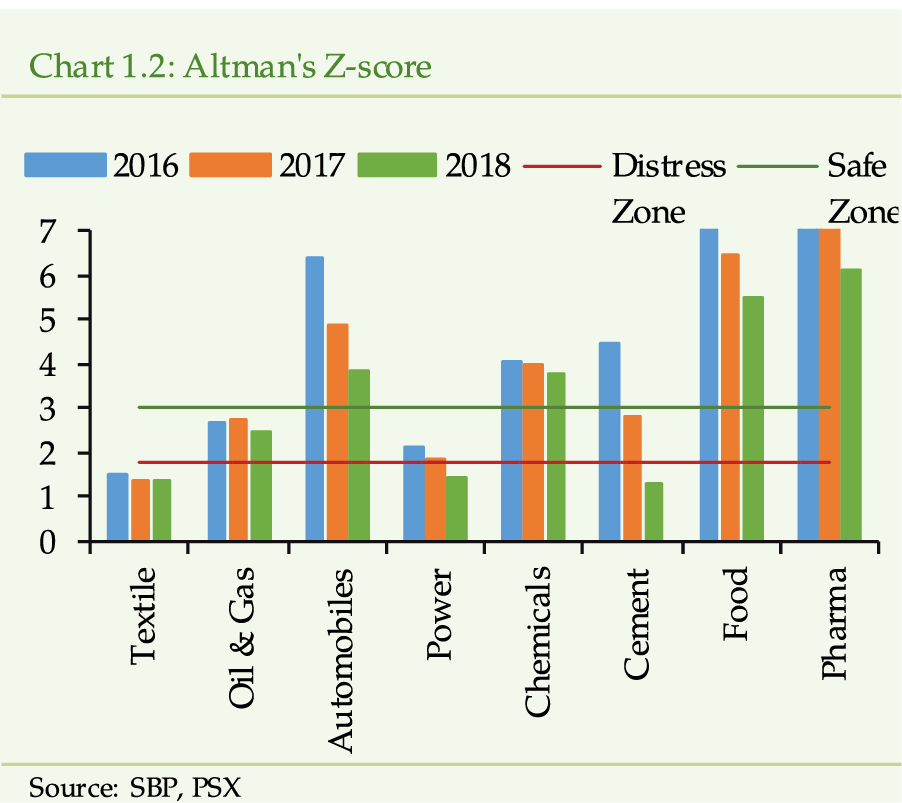
According to the applied
model, textile sector constantly falls under distress zone due to the poor
working capital management as compared with the other sectors that has lead
them to earn lowest ROE. Moreover, the market value of equity as the ratio
of book value of debt also remains quite low constantly.
Cement sector faces the
most drastic decrease (70.5percent from CY16 to CY18) in the Altman Z-score.
Primarily, the higher rate of growth of debt levels as compared with the
growth of asset base lead to decline in the score. Simultaneously, the weakening
of working capital affected the liquidity position of the sector. Over the
years, the market value of equity of the cement sector also deteriorated
as a reflection of poor performance. Thus, in CY18, the Z-score stands at
1.32.
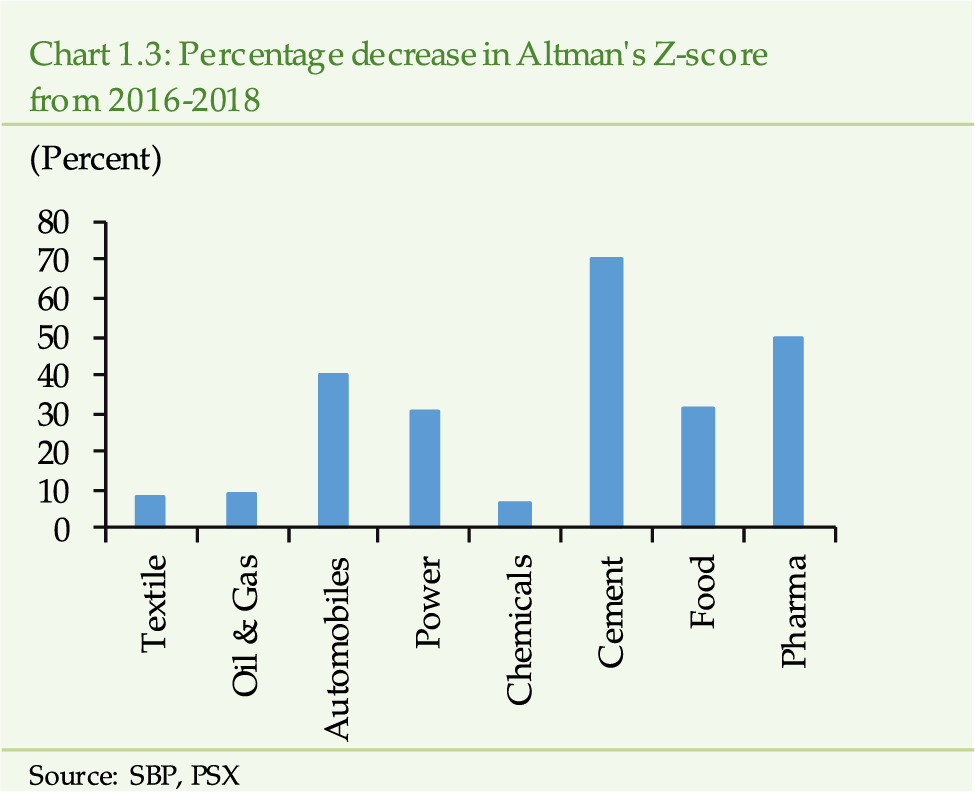
The Altman Z-score of the remaining sectors also decreased during the CY18, given the slowdown of economic activity (Chart 1.3). Besides cement sector, the pharmaceutical and automobile sector faced severe decrease in the Z-score. Nevertheless, their score remains quite above the safe zone.
[1]
The corporate sector performance has been assessed using financial
statements of 303 companies listed on Pakistan Stock Exchange (PSX). As
such, the analysis entails generalization for the entire corporate sector.
[2]
For 2018, the detailed financial position and performance have
been interpolated based on the key summary statistics (i.e. Total Assets,
Shareholders Equity, Sales and Profit) which had been reported by these
companies at the time of this assessment exercise.
[3] http://www.finance.gov.pk/
budget/budget_speech_english_2018_19.pdf
[4]
Keeping the Financial Leverage constant for the CY18 at 2.14,
the ROE will fall to 14.4 percent. Thus, the increase in financial leverage
has provided cushion to the declining ROE.
[5]
JS Global (2019). Pakistan Equity Strategy 2019. Karachi, January.
[6]
HUBCO and KAPCO (market share approximately 64 percent) revealed
that they generated 11469 GWh in CY18 (13986 GWh in CY17).
[7]
Government introduced the Super Tax on individuals, association
of persons (AOPs) and companies earning income above PKR 500 million in
tax year 2015 at rate of 4 percent of income of banking companies and 3
percent on other categories for rehabilitation of temporarily displaced
persons through Finance Bill (2015-16).
http://www.finance.gov.pk/
budget/budget_speech_english_2018_19.pdf
[8]
FED on imported vehicles amended from 20 percent on vehicles
above 1800cc to 25 percent for vehicles between 1800cc and 3000cc, and 30
percent for 3000cc or above.
[9]
The short-term PD (1 Year PD) is mainly driven by the quality
of firms liquidity management and ability to honor short-term obligations,
while long-term PD (5 Year PD) is mainly influenced by solvency position
and overall financial soundness of the firm.
[10] State Bank of Pakistan is following a strategy to promote the rating culture through indirect measures.
In this regard, SBP requires banks and DFIs to hold
higher capital against large exposures to unrated firms.
[11] PACRA. (2019). Rating Scale. Pakistan, March. http://www.pacra.com.pk/
uploads/doc_report/PACRA_
Rating%20Scale_Corporate_FY18.pdf
[12] World Bank. (2019). Doing Business 2019: Training for Reform, Economy Profile Pakistan. Pakistan, March http://www.doingbusiness.org/content/dam/
doingBusiness/country/p/pakistan/PAK.pdf
[13]
Pakistan Doing Business Reforms
http://boi.gov.pk/ViewNews.aspx?NID=3089
[14]
It is a digital central trade hub for clearance of cross-border
consignments
https://www.thenews.com.pk/print/408956-pakistan-customs-green-signaled-to-implement-national-single-window
[15]
Eidleman, G. J. (1995). Z scores-A Guide to failure prediction. The
CPA Journal, 65(2), 52.
[16]
The parameters of the model as identified in the original paper
have been used to signal distress status of the firms and have not been
calibrated to the local conditions. As such, the model may under/overestimate
the distress factor. However, the current model provides a useful benchmark.
6 Performance and Soundness of Financial Market Infrastructures
Financial Markets Infrastructures (FMIs) are critical
components of financial system of a country. They comprise of important
institutions, instruments and channels, which facilitate the process of
financial intermediation by processing and recording the flow of funds and
securities. Hence, the overall stability of the financial system is critically
dependent upon their efficiency and resilience.
FMIs broadly cover the Payment Systems, Central
Securities Depositories (CSD), Securities Settlement Systems (SSS), Central
Counter Parties (CCPs) and trade repositories.
[1]
Pakistans major FMIs include large value payment system (LVPS)
i.e. Pakistan Real-Time Interbank Settlement Mechanism (PRISM); one inter-bank
switch (1-Link); one clearing house of paper-based instruments (NIFT); one
corporate securities settlement company (NCCPL); and one corporate securities
depository (CDC). The capital market infrastructures is regulated by SECP.
6.1 Payment Systems [2]
Under its Vision 2020, SBP has set the Development
of Modern and Robust Payment Systems as one of its key strategic objectives.
Hence, it is continuously working towards the modernization of countrys
payment systems and simultaneously enhancing its regulatory and supervisory
regime to ensure their efficiency and resilience.
Based on the quantum of values transacted, the
countrys payment system is divided into Large Value Payment Systems
(LVPS) and Retail Value Payment Systems (RVPS). Pakistans LVPS,
i.e. PRISM is used for wholesale transactions of both funds and government
securities among its participants. Moreover, it is now increasingly being
used for third party fund transfers. On the other hand, RVPS is composed
of various paper-based and electronic channels used for retail transactions.
Both PRISM and RVPS have shown a consistent increase in volume and value
(Table 6.1).
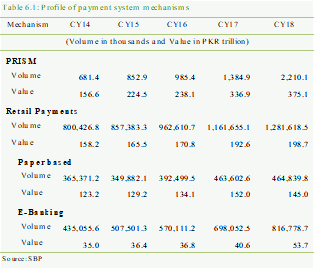
PRISM
remains efficient and resilient
In line with the trend of CY17, PRISM has witnessed
consistent growth in both volume and values. In aggregate, during the reviewed
period, it has settled 65.37 percent of the total value of all payments,
amounting to around 11 times of GDP.
The daily average volume of settled transactions
has shown significant growth over the past year to reach 9,209 (CY17: 5,770),
while daily average value has increased to PKR 1,563 billion (CY17: PKR
1,404 billion).
Overall, during CY18, volume and value of transactions
settled through it grew by 59.58 percent and 11.34 percent, respectively.
Encouragingly, the lions share of growth in volume and value came from
Inter-bank Funds Transfers (IFT). It registered a growth of 65.68 percent
in volume and 19.33 percent in value (Chart 6.1 and 6.2).
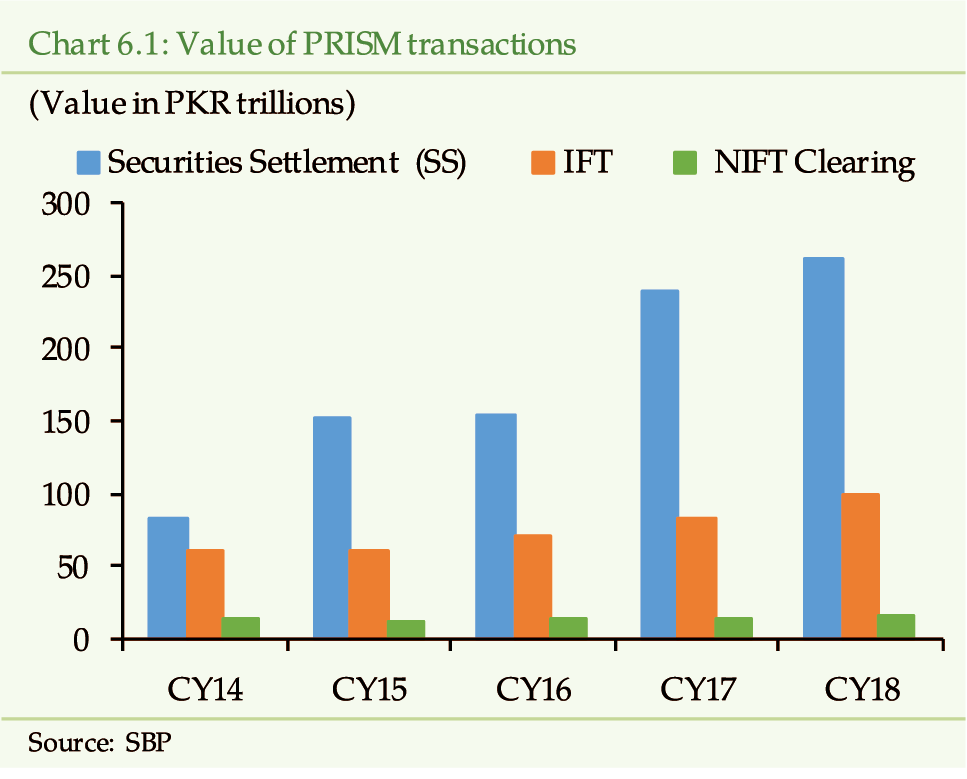
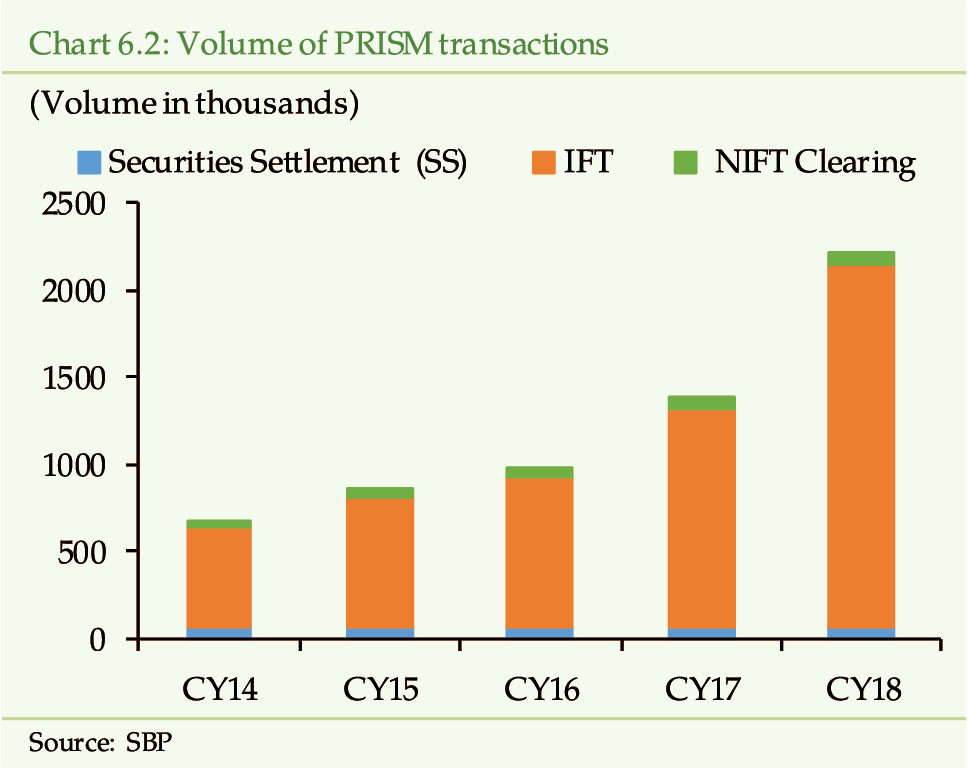
Within IFT, bulk of the growth has come from third
party customer transfers. The trend of IFT is in line with the previous
two years and is a result of continued efforts by SBP to popularize the
use of RTGS system by banking consumers. In this regard, SBP has implemented
straight-through processing via PRISM in 2016, whereby the core banking
system of banks and PRISM system have been integrated to improve efficiency
and minimize errors in payment processing.
[3]
Furthermore, SBP has allowed banks to use PRISM free-of-charge
for same-day settlement of domestic transfers of home remittances to their
beneficiaries. Consequently, use of PRISM for home remittances have seen
a 63.56 percent rise in volume and 61.84 percent in value during CY18. This
has garnered the trust of the banks and the banking consumers in the countrys
RTGS system.
Over the past decade, PRISM has undergone significant
developments with respect to its operations. New features such as 3rd
party fund transfers, straight through processing, interbank fund transfer
of home remittances, membership of clearinghouses, CDNS, NCCPL etc. have
been added to its functionality. Moreover, PRISM system was upgraded in
CY17, which included enhancement in its features such as revised criteria
for intra-day liquidity facility, improvement in reconciliation process
and increased efficiency in managing funds and securities balance. To cater
to these developments, SBP has issued new PRISM operating rules in March
2018, which incorporated these changes. Apart from this, the new rules have
been aligned with Principles for Financial Market Infrastructures (PFMIs)
issued by Bank for International Settlements, incorporating participation
access criteria, settlement and finality, efficiency and effectiveness etc.
[4]
Keeping in view the increasing risk of cyber-attacks,
SBP has taken adequate measures to ensure that PRISM remains resilient.
PRISM participants access the system through a private network, which is
further safeguarded through dynamic multipoint network level encryption
and a certification authorization system for generation of digital signatures
and identity verification to cater to the risk of unauthorized access. Moreover,
next generation firewalls for application and network filtering, robust
malware protection and intrusion detection and prevention systems are implemented
to mitigate the risk of cyber breaches. Further, to ensure that the PRISM
system remains resilient to any system disruptions, SBP has maintained separate,
well-functioning business continuity and disaster recovery sites which are
tested frequently.
Retail Value Payment Systems post continued growth
Comprising of paper-based and electronic modes
of transactions, the retail payment systems of the country has also posted
robust growth in volume and value of electronic transactions. The overall
volume of transactions has surged by 10.33 percent whereas the value of
transactions has increased by 3.17 percent (Chart 6.3).
Within retail payments, the volume-wise share of paper-based transactions
declined from 39.92 percent to 36.27 percent, which reflects the growing
trend of e-banking transactions (Chart6.4). In terms of value transacted,
paper-based modes still hold a major share in retail payments, accounting
for 72.99 percent of value transacted.
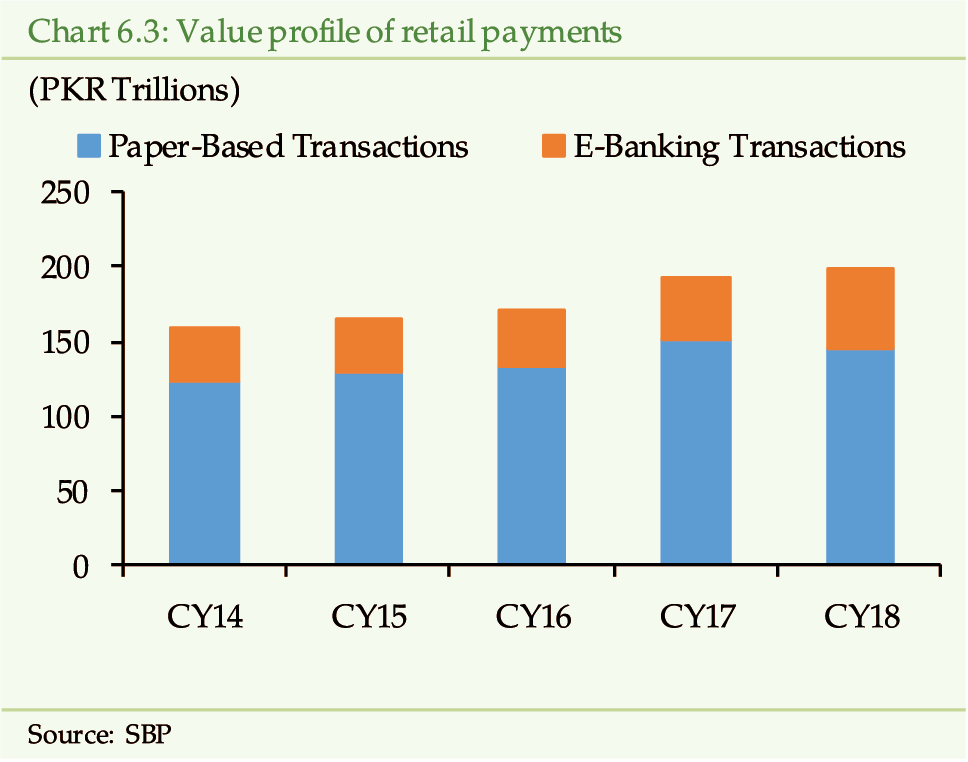
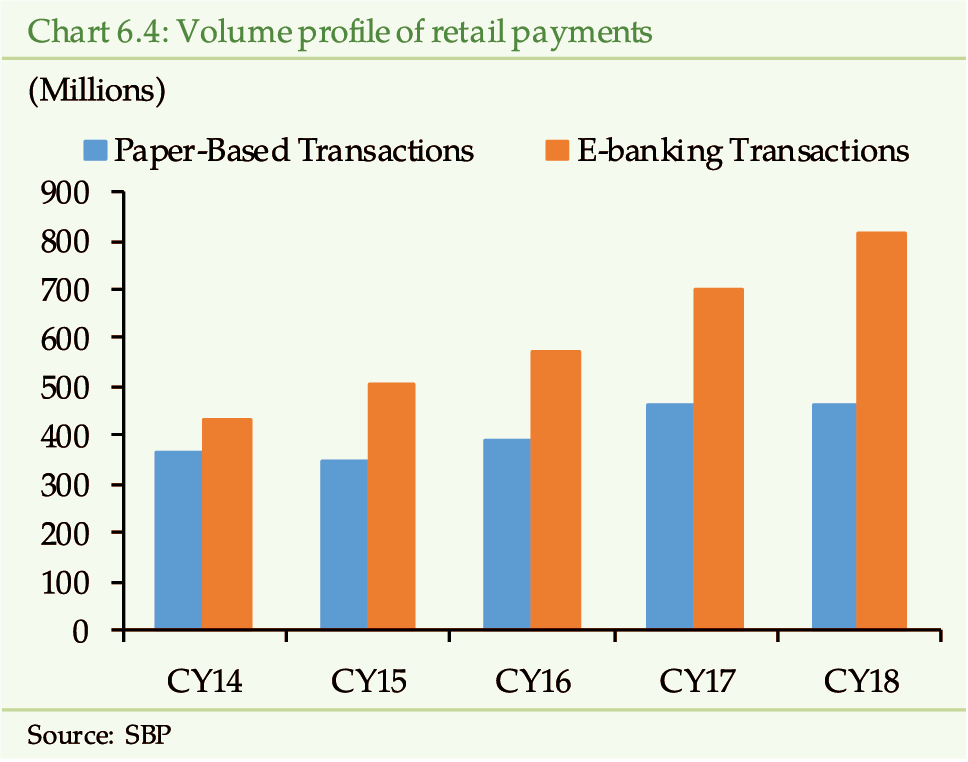
Within the paper based transactions, Cheques remain
the most popular instrument as they accounted for 50.85 percent of total
volume and 75.70 percent of total value transacted (Chart 6.5).
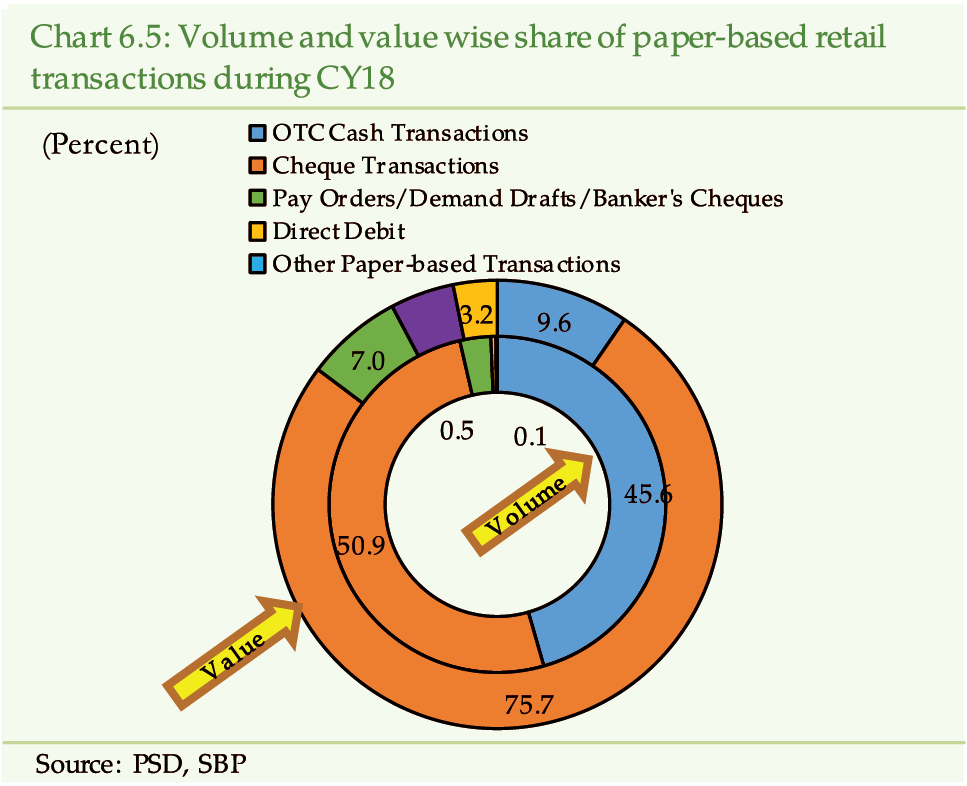
Within cheque based transactions, major share of
volume pertained to cash withdrawals amounting to 50.56 percent of total
cheque transactions. However, the share of value remained low at 10.71 percent
(Table 6.2). This points out to the possibility that banking consumers
are using cheques for withdrawals of smaller amounts to avoid the cost of
withholding tax on banking transactions, particularly by non-filers.
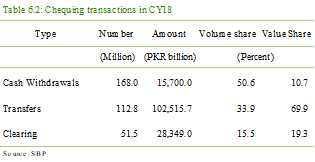
Non-cheque
based transactions remain low in value
Non-cheque based transactions, which primarily
reflect over-the-counter (OTC) cash transactions accounted for only 9.58
percent of the total paper-based value transacted. As banks offer ease of
services such as utility bill payments and interbank funds transfers through
their digital platforms, consumers are increasingly using these electronic
channels against OTC transactions.
Electronic
modes of transaction show healthy growth
Electronic modes of transaction have been a major
contributor to growth in retail payments during CY18. In line with the development
in previous year, e-banking channels have shown robust growth in both volume
and amount transacted. Overall, the volume of e-banking transactions has
registered a growth of 17.01 percent, whereas the value of these transactions
has increased by 32.33 percent to reach at PKR 53.67 trillion. The share
of electronic transactions, within retail transactions, has increased to
27.01 percent in CY18 compared to 21.04 percent in CY17. This is a manifestation
of the shifting trend towards these digital modes that offer greater convenience
and efficiency of payments to consumers.
Among e-banking transactions, Real Time Online
Banking Transactions accounted for 84.20 percent of the value transacted
followed by ATM transactions, which amounted to 11.29 percent (Chart
6.6). With respect to volume of transactions, ATM transactions account
for a major share (61.94 percent) (Chart 6.7).
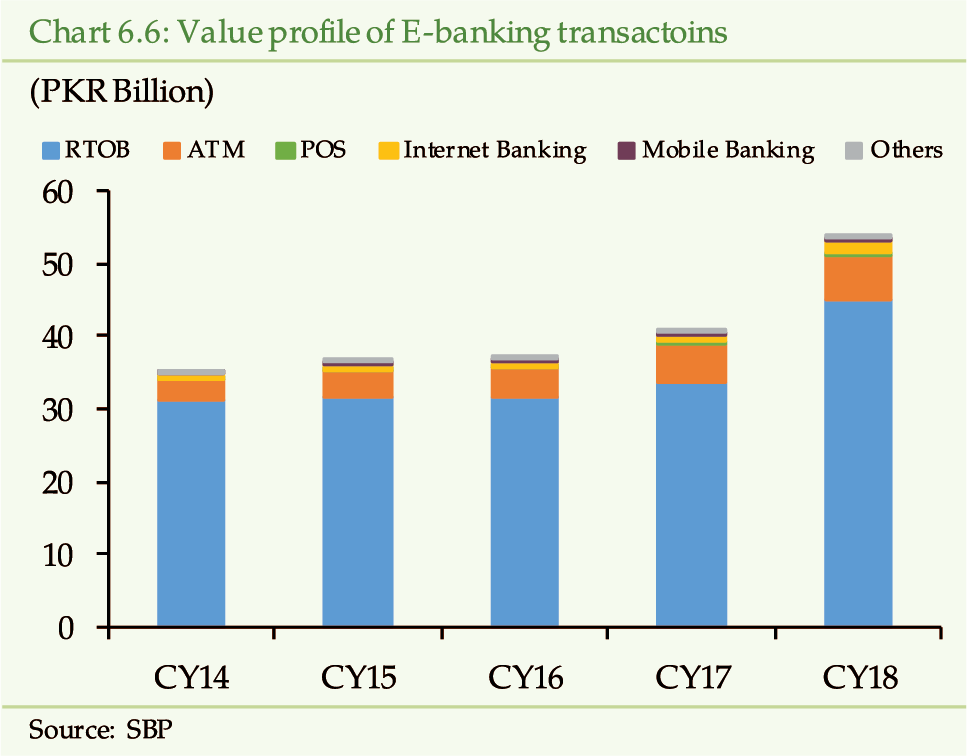
Encouragingly, the share of alternate delivery
channels (ADCs), particularly mobile and internet banking has been growing,
albeit gradually. In terms of growth, internet banking posted a healthy
growth of 33.23 percent in volume and 39.25 percent in value. In aggregate,
PKR 2.1 trillion were transacted through internet banking, mobile banking
and point-of-sale (POS) channels during CY18 as compared to PKR 1.6 trillion
last year. This is reflective of the growing trust of banking consumers
on alternate delivery channels offered by the banks.
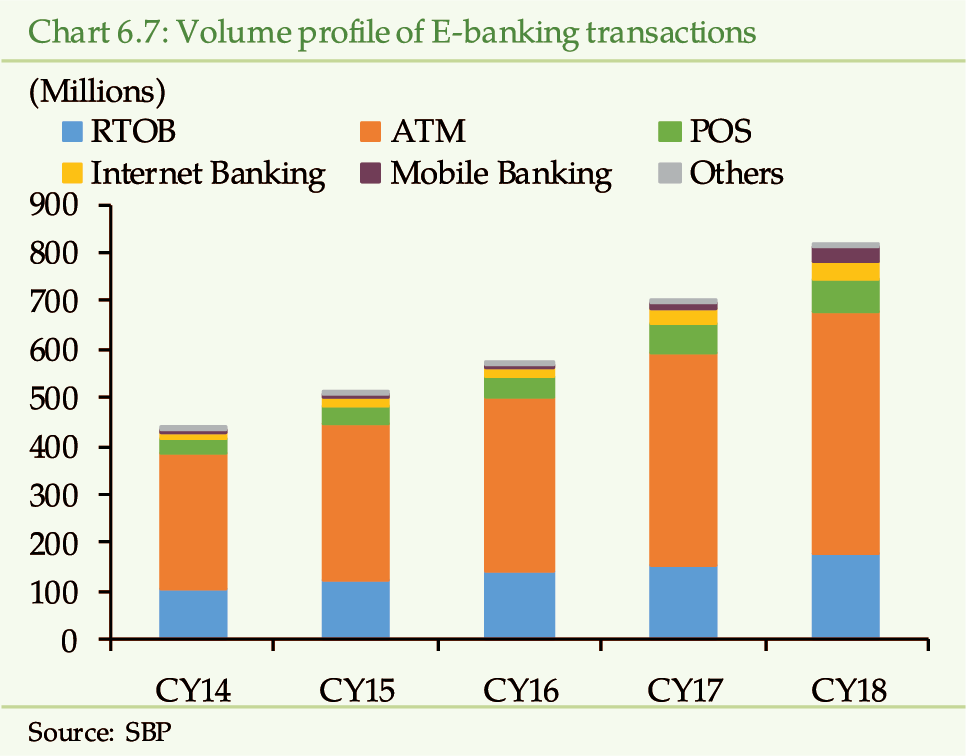
Increasing
investment in e-banking infrastructure
Cognizant of the increasing adoption of e-banking
channels, commercial and microfinance banks are increasing their investments
in ADCs to tap into the growth potential as seen by an increase in online
branches and ATMs. Furthermore, similar increase is visible in the number
of credit and debit cards issued by banks (Table 6.3).
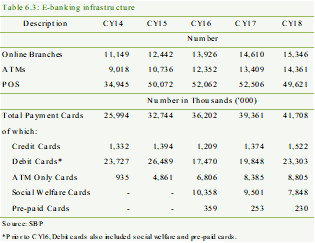
Paypak
adoption continues in CY18
In pursuance of SBP Vision 2020 and National Financial
Inclusion Strategy (NFIS), 1-Link, with the approval of SBP, has launched
the countrys first domestic payment scheme in 2016, with the aim to provide
a low-cost, efficient and secure payment solution.
[5]
Since its launch, Paypak has made significant inroads in the
payments landscape of the country, which is evident by its increasing adoption.
A total of 18 banks (14 commercial banks and 4 microfinance banks) have
issued around 1.12 million cards as of December, 2018 as compared to 0.75
million cards at the end of CY17.
SBP
has issued comprehensive guidelines for retail payments in the wake of rising
cyber-attacks
Rise in threats of cyber-attacks is a global phenomenon.
World Economic Forums Global Risks Report, 2019 also mentions cyber-attacks
as one of the top 10 risks in terms of both likelihood and impact. As more
and more customers start adopting electronic modes, electronic channels
have become a target for cyber-criminals. Results of the 3rd
wave of the SBPs Systemic Risk Survey also points out that the respondents
have rated cyber security risk as one of the top 10 risks for the financial
sector (See Box 1).
In the wake of increasing threats of cyber-attacks,
SBP has issued a comprehensive circular on security of digital payments
to safeguard banks and their customers from potential losses. The circular
includes measures such as extensive vulnerability assessment and penetration
testing of banks technological infrastructure to identify potential weaknesses
in their ADCs and payment systems. Furthermore, it has been made mandatory
for banks to provide free of cost SMS and email alerts with respect to both
domestic and international digital transactions to their customers, serving
as a detective control in case of a cyber-attack or fraud. Further, the
circular entails deployment of real-time fraud monitoring tools and alert
mechanisms by banks for the detection of fraudulent activities and dissemination
of education to customers regarding types of online banking frauds.
[6]
In order to mitigate the risk of payment-card related
frauds such as skimming, SBP has already instructed the banks to issue secure
cards which are compliant with Europay, Mastercard and Visa (EMV) Standard
and replace all the existing cards with chip-and-PIN payment cards by December,
2019.
[7]
ATM
downtime reduces further
ATMs possess the highest share in volume of e-banking
transactions and is a medium, which is designed to be available round the
clock. Hence, they are critically important infrastructures and any disruption
in their working due to banks system failure, poor connectivity, power
outages and inadequate cash replenishment may lead to operational as well
as reputational risk for the banks. Owing to improved surveillance and concerted
efforts of SBP, the downtime of ATMs has reduced further during CY18, indicating
improved efficiency (Chart 6.8).
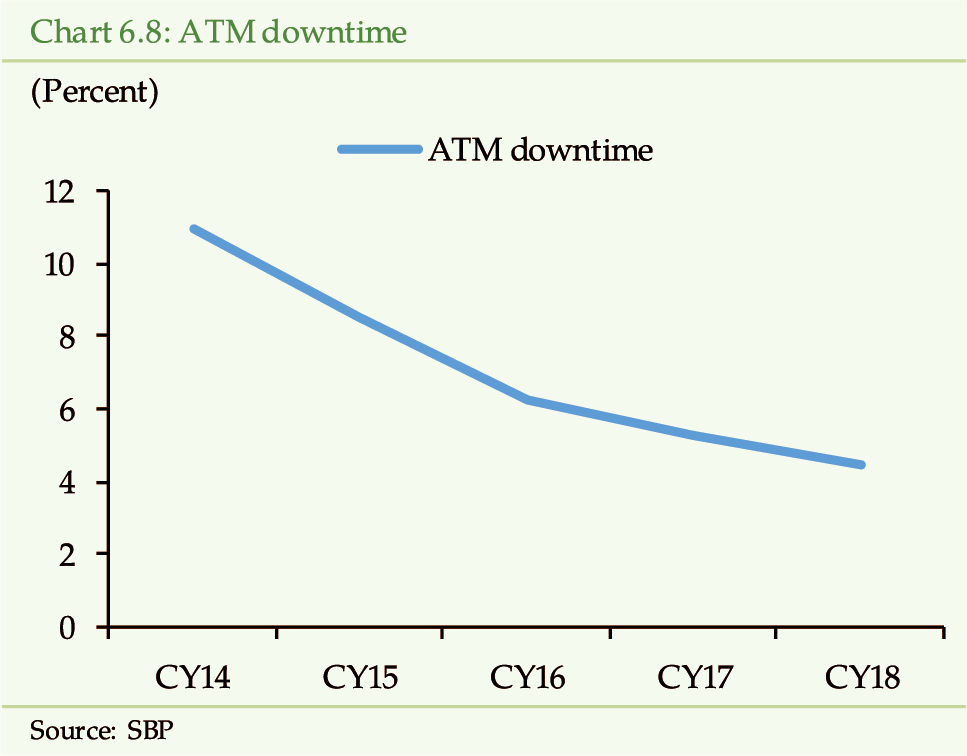
Settlement
and liquidity risks in retail payments are managed effectively
Since Pakistans retail payment segment works on
Deferred Net Settlement (DNS) basis i.e. T+1 basis, it entails creation
of overnight credit risk before a transaction is settled the next day. Various
safeguards are in place both by banks and SBP. Banks have imposed per day
transfer limits for both retail and corporate customers. On the other hand,
SBP has imposed cash reserve and statutory liquidity requirements on banks
to ensure that sufficient liquidity is available in their accounts with
SBP BSC to cover the settlement amount. Moreover, since the transactions
are settled in PRISM, the availability of intra-day liquidity facility (ILF)
assuages the liquidity risk as well.
Branchless
Banking, shows continued growth
Branchless banking is another key element of the
retail payments landscape of Pakistan. It serves as a catalyst for financial
inclusion and has tremendous potential to expand the outreach of financial
services to the financially excluded populace. Continuing its growth trend,
number of branchless banking accounts, deposits and number of transactions
have registered robust growth during CY18 (Table 6.4). To cater to
customer due diligence (CDD) risk related to branchless banking transactions,
SBP has put in place extensive requirements such as verification of customer
particulars from NADRA, biometric verification, transaction and maximum
balance limits.
[8]
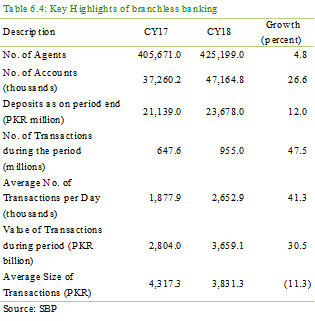
SBP continues to promote innovations while
managing risks
SBP is encouraging Payment System Operators (PSOs)
/ Payment System Providers (PSPs) such as payment aggregators, electronic
wallets and e-commerce gateways, which will add value to the payments landscape
of the country. Such non-banking technology-based firms provide various
services such as clearing, routing, switch services and electronic facilitation
of payments, thus providing efficiency and convenience to customers. In
this regard, SBP has issued detailed Rules for Payment System Operators
and Payment Service providers.
[9]
These regulations are aimed at encouraging their growth,
managing risks, and bringing them into the regulatory ambit.
CY18 has also witnessed a growing interest in virtual
currencies around the globe and in Pakistan, followed by regulatory actions
in various jurisdictions. These virtual currencies saw huge bouts of volatility
in their value during the reviewed period. Keeping in view the growing regulatory
concerns, escalating price volatility and supervisory actions around the
globe, SBP has advised all Banks/MFBs/DFIs/PSO/PSPs against dealing in them.
[10]
It is pertinent to mention that SBP has been proactive
in monitoring and managing the risks associated with the use of virtual
currencies as evident from the fact that SBP and SECP had also previously
issued a joint Public Warning, in September, 2016, cautioning the public
about using Bitcoin and other virtual currencies.
Some of the risks that virtual currencies may pose include: a) significant price volatility associated with speculative activity, which may prove to be harmful for the uninformed investors; (Chart 6.9) b) failure/closure of virtual currency exchanges/businesses due to any reason including action by law enforcement agencies; and c) hacking/security compromises of crypto currency exchanges and wallet businesses as a number of instances were recorded around the world where huge amount of funds have been lost due to the exchange/wallet operations being hacked/compromised. However, SBP remains open to technological innovations (including distributed ledger technology) which can enhance the efficiency of financial services. It continues to explore possible uses of technologies while keeping in view integrity, stability and consumer protection concerns of the financial sector.
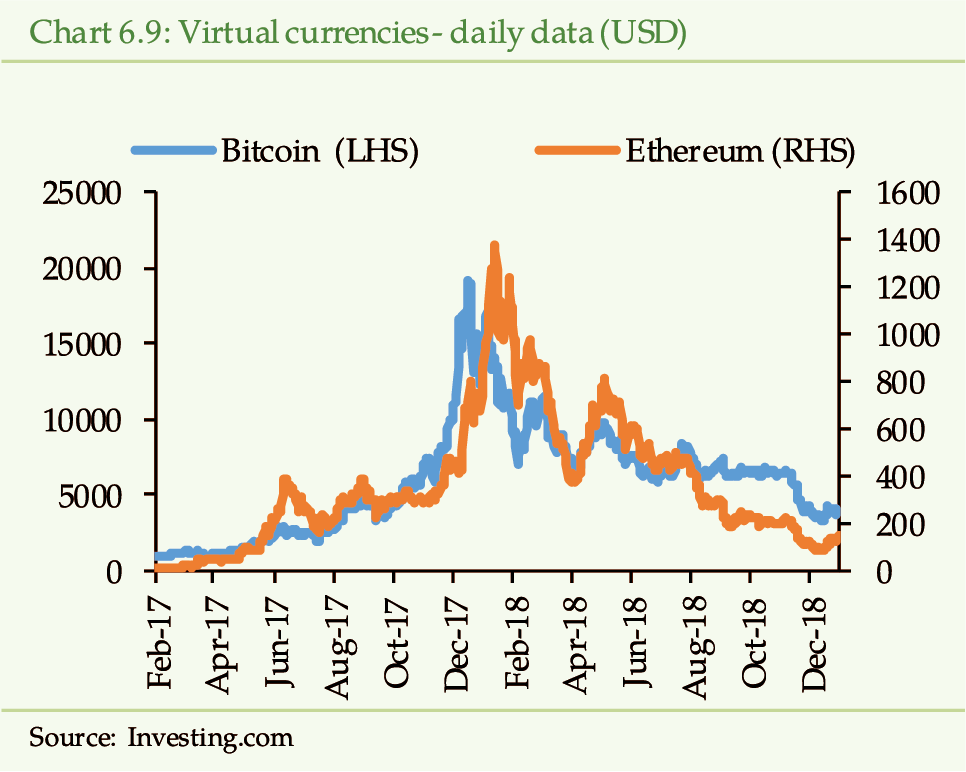
Managing
Systemically Important Payment Systems (SIPS)
Payment systems are at the core of a financial
system. Owing to their importance, any disruption in processes or flaw in
their design can result in emergence of systemic risk. In view of this,
SBP has already improved the oversight of some of the payment systems such
as NIFT and 1-Link. Under the Payment Systems Designation Framework issued
by SBP, it is finalizing the designation, which will allow it to perform
closer supervision of SIPS.
[11]
6.2 FMIs other than Payment Systems
NCCPL
aligns its risk management regime with its role as CCP
NCCPL has become a systemically important FMI,
keeping in view its assumption of the role of Central Counter Party (CCP)
in May 2016. Dealing with the settlement of trades in the capital markets,
it took various measures to enhance the efficacy of its operations and strengthen
its risk management regime.
It became a special participant of PRISM in January
2018 enabling the efficient settlement of NCSS transactions. Instead of
settlement through multiple settlement banks, the transactions are now settled
via PRISM in the form of multilateral net settlement batches (MNSBs), thus
reducing the operational risk. Furthermore, multilateral netting also mitigates
the liquidity risk posed to the broker clearing members (BCMs).
In order to placate the settlement risk arising
due to potential default of any member, NCCPL maintains a Settlement Guarantee
Fund (SGF). The fund was valued at PKR 2.75 billion at its inception and
witnessed a gradual accretion of 6.0 percent over the current year to reach
at PKR 3.28 billion in December, 2018. However, the daily average settlement
value for the year stood at PKR 5.7 billion, which is greater than the value
of fund (Chart 6.10). Although the margins provided by clearing members
are the first line of defense against default risk, SGF provides a buffer
against emergence of systemic issues in the capital market.
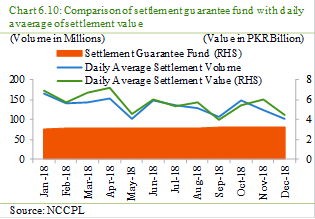
In view of its role as a CCP, NCCPL has augmented
its risk management regime during CY18. Initially, the risk management system
of PSX was employed by NCCPL. Effective from 30th July, 2018,
NCCPL has implemented its own in-house risk management system. Besides having
similar features, the new system would enable NCCPL to efficiently supervise
the risk profile of clearing members and employ adequate safeguards against
the emergence of settlement risk, if any.
Custodial
risk remains low
CDC is another key FMI, which acts as the central
securities depository (CSD) of the country. It manages and operates the
Central Depository System (CDS), which is an electronic book-entry system
used to record and maintain securities and register their transfers. Hence,
it performs a two-pronged function i.e. the facilitation of trade in securities
and management of the custodial risk associated with it.
CDC continues to hold the trust of the general
public as evident by the increasing number of investor accounts, which stood
at 53,896 at the end of CY18. The CDS handled a total of 138 billion shares
with a market capitalization of PKR 4.7 trillion at the end of the reviewed
period.
[12]
In terms of facilitating the market, CDC has undertaken
numerous measures, which include establishment of the Centralized e-IPO
system, MAccess-CDC Access Mobile Application-that offers the investors
convenience of managing their accounts through mobile phones and an eDividend
repository in line with provisions of Companies Act, 2017.
[13]
Being an electronic book-entry system makes CDS
vulnerable to IT security risk. To ensure the safety of investors assets,
CDC has put in place sufficient safeguards. This is evinced by the fact
that it is an ISO 27001 certified company, ensuring that it has adequate
controls in place to ensure information security. Moreover, it has also
obtained ISO 22301 and ISAE 3402 certifications, which deal with business
continuity management and internal controls. Further, CDC has partnered
with 1Link to add the feature of IBAN validation and title fetching mechanism
in CDS to ensure synchronization of account titles, thus reducing the operational
risk.
Increasing
interconnectedness and cybersecurity issues needs joint supervisory attention
With each year the countrys FMIs depict a growing
level of interconnectedness. On the one hand it results in efficiency gains
in terms of their usage and increasing expediency to consumers, whereas
on the other hand, it can potentially pose a higher level of systemic risk.
Coupled with this, the global emergence of cyber-security risk may pose
a challenge to the smooth and efficient working of these FMIs. Going forward,
managing these risks will require further strengthening of entity-level
risk management regimes along with regulatory coordination between SBP and
SECP. In this regard, Council of Regulators (CoR), a forum for regulatory
collaboration, is already actively working.
[1]
An FMI is defined as a multilateral system among participating
institutions, including the operator of the system, used for the purposes
of clearing, settling, or recording payments, securities, derivatives, or
other financial transactions. Committee on Payment and Settlement Systems
of BIS, (2012), Principles for Financial Market Infrastructures.
[2]
By virtue of the powers entrusted to it, SBP plays the role of
regulator, operator and facilitator of Pakistans payment systems. Article
3 of the Payment Systems and Electronic Funds Transfer Act (PSEFT), 2007,
endows upon SBP the power to regulate the countrys payment systems to ensure
their soundness, possible emergence of systemic risk and interests of the
general public.
[3]
PSD Circular No. 2 of 2016;
http://www.sbp.org.pk/psd/2016/C2.htm
[4]
Payment Systems Review FY18
[5]
The scheme is operated by 1-Link.
[6]
PSD Circular No. 9 of 2018;
http://www.sbp.org.pk/psd/2018/C9.htm
[7]
PSD Circular No. 5 of 2016;
https://www.sbp.org.pk/psd/2016/C5.htm
[8]
BPRD circular No. 9 of 2016;
https://www.sbp.org.pk/bprd/2016/C9.htm
[9]
PSD Circular No. 3 of 2014;
http://www.sbp.org.pk/psd/2014/C3.htm
[10]
BPRD Circular No. 3 of 2018;
http://www.sbp.org.pk/bprd/2018/C3.htm
[11]
PSD Circular No. 2 of 2017;
https://www.sbp.org.pk/psd/2017/C2.htm
[12]
CDC Newsletter, Oct-Dec, 2018
[13]
CDC Newsletters, Jan-Dec, 2017
7 Financial
Inclusion and Financial Stability
Pakistan has come a long way in financial inclusion
as today branchless banking and m-wallet accounts have expanded the access
to far-flung areas of the country. The Microfinance banking sector, the
key actor in financial inclusion landscape, continues to perform exceedingly
well even in the face of general slowdown in the economy in CY18. MFBs asset
base, deposits, advances have shown promising growth and the CAR has improved.
From the financial stability perspective, growing financial inclusion poses
limited concerns.
Pakistan re-launched the National
Financial Inclusion Strategy with renewed commitment during 2018
Pakistan is one of the pioneers in providing an
enabling and conductive policy and regulatory framework for financial inclusion.
Considering the benefits associated with enhanced financial inclusion (See
Box 6), its longstanding commitment to inclusive finance was stepped
up into a comprehensive National Financial Inclusion Strategy (NFIS) in
2015.
NFIS is based on four drivers: (i) promoting digital
transaction accounts and reaching scale through bulk payments, (ii) expanding
and diversifying access points, (iii) improving capacity of financial service
providers, and (iv) increasing levels of financial awareness and capability.
Under each category, a set of targets have been identified that are to be
achieved by the year 2020. With the renewed commitment of the new government,
the magnitude of various targets of NFIS have been revised during 2018,
under the 100-days agenda, and the deadline has been extended to 2023 (See
Exhibit)
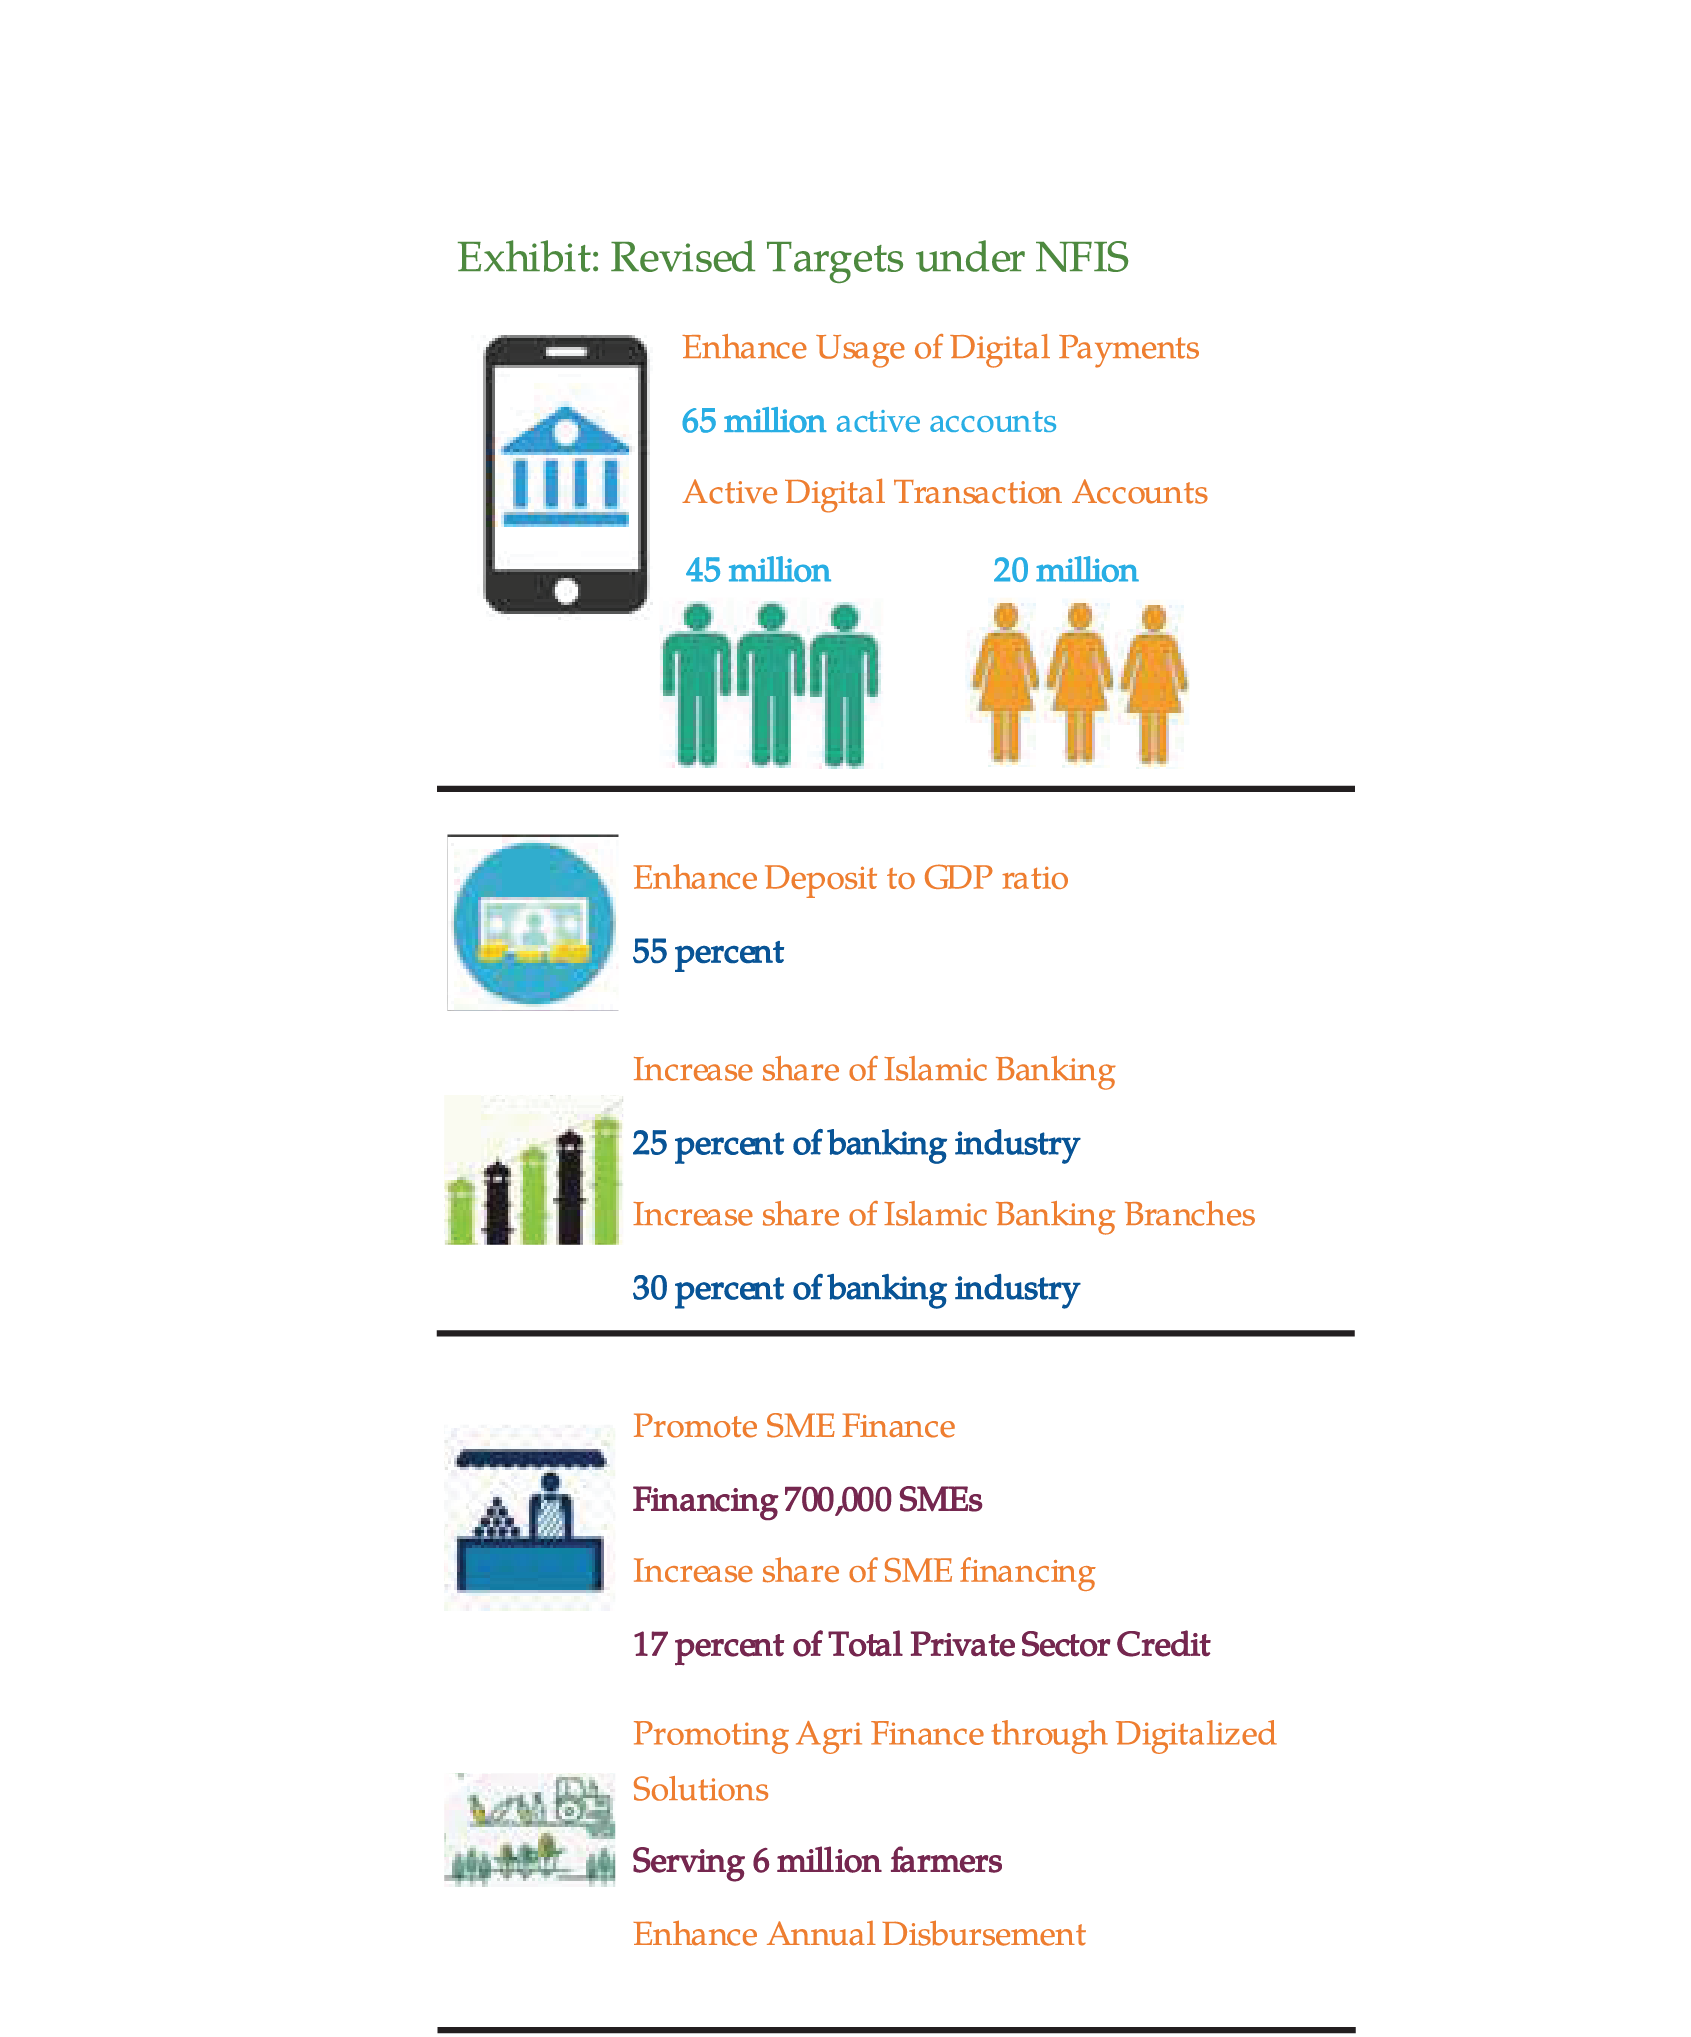
NFIS envisages utilizing all possible channels
A common misconception is that only Microfinance
institutions are responsible for banking the unbanked. However, all financial
institutions including banks and non-banks have their role to play in enhancing
financial depth and breadth. This is the reason that NFIS has envisaged
utilization of all possible channels for increasing access.
Commercial
banks facilitating in Financial Inclusion agenda, though at a slower pace
To achieve the targets set under NFIS, the banks
are also aiding by expanding the branch network, deposit base and financing
to SME, Housing and Agriculture sectors. During CY18, banks have increased
their branch network by 5 percent to 15,346.
[1]
Under SME financing, the number of borrowers have increased by
8.7 percent to 177,796 while financing has grown by 12.39 percent.
Housing finance, however, has decelerated recording
a growth of 21.62 percent in CY18 compared to an increase of 31.85 percent
in the previous year. Among others, the challenging economic environment
seems to be having an impact on housing finance. Nevertheless, the number
of borrowers have inched up by 9 percent to reach 16,320 in CY18. Agriculture
financing, on the other hand, has reduced by 2.44 percent in CY18 (See
Chapter 3.1).
SBP, cognizant of the need to keep up the pace
of NFIS, has taken several measures to promote priority sector financing.
It has provided indicative targets to the banks & DFIs to achieve the
goal of SME financing equivalent to 17 percent of total private sector credit
by 2023. In case of low cost housing, SBP has announced Financing Facility
for Low Cost Housing for Special Segments at concessional rate.
[2]
Further to its efforts, a National Financial Literacy Program
(NFLP) has been launched.
The
Microfinance sector is the biggest player of financial inclusion landscape
in Pakistan
Microfinance Banks (MFBs) remains a pivotal player
in the financial inclusion landscape in Pakistan. MFBs constitute almost
70 percent of the total loan portfolio of the microfinance sector followed
by Microfinance Institutions (MFIs) with 20 percent share.
[3]
The assets of MFBs have increased by 32.7 percent
during the CY18 compared to a 7 percent increase in assets of commercial
banks (Table 7.1 & Chart 7.1). Accordingly, share of MFBs assets
in the total banking sector assets has reached to 1.62 percent in CY18 from
1.31 percent in CY17 (0.57 percent in CY14).
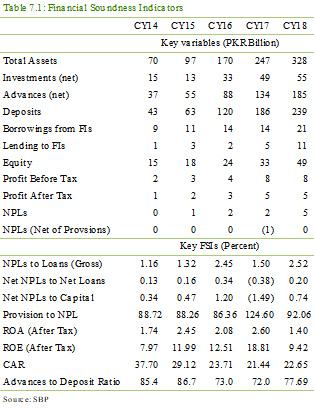
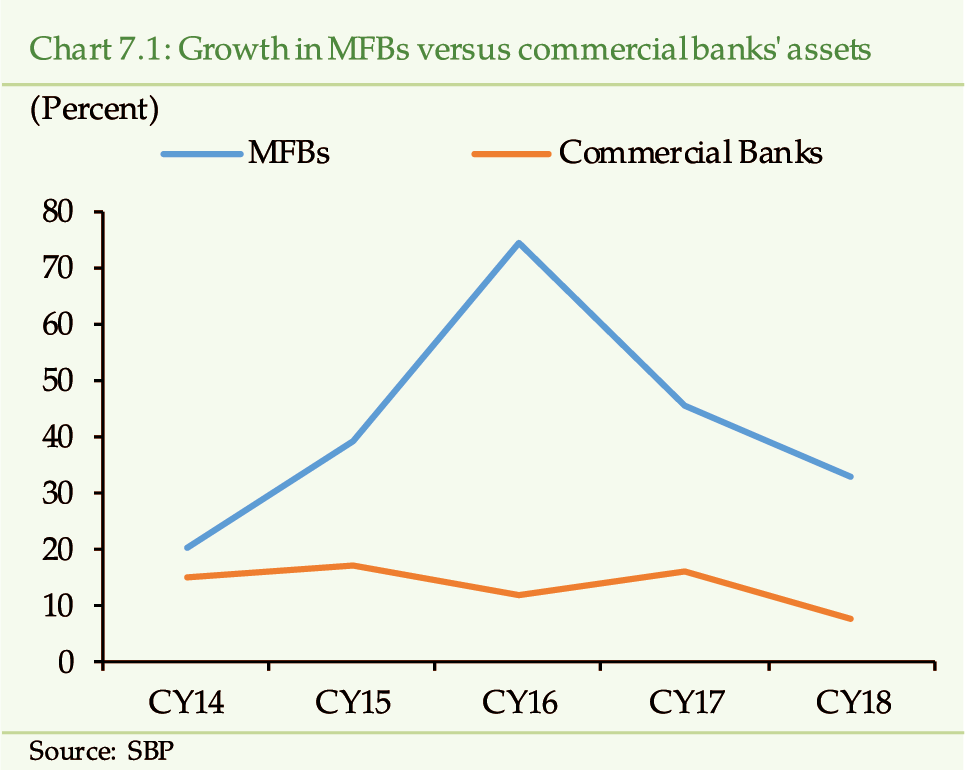
Advances of MFBs have recorded a healthy growth
of 38.6 percent during CY18, while number of loans have increased by 40
percent to 2 million. As a result, the share of MFB loans has increased
to 2.25 percent of banking sector loans in CY18 as compared to 1.99 percent
in CY17.
MFBs are effectively playing the intermediary role
as the ADR improved by 5.7 percentage points to 77.7 percent in CY18. This
improvement, among other factors, has come on the back of 20 percent growth
in the number of MFBs clients, which have increased to 3,169,785 in CY18.
The
microfinance banking sector is maturing
The MFBs started their business with group lending
model. Over the years, the financing model has shifted from the solidarity
groups to individual lending. At the end of CY18, the share of individual
financing in total financing has reached to 71.76 percent from 65.14 percent
in CY17. This increase is attributed to maturity attained by microfinance
industry and the development of effective borrower assessment criteria.
The adoption of technology by MFBs and increase in financial literacy among
the lower income strata is also helping MFBs to focus on individual lending
rather than group lending.
The
deposit growth momentum accelerates helping MFBs attain self-sufficiency
in funding
The deposit base of MFBs has been expanding helping
them achieve self-sufficiency in their funding requirements (Table 7.1).
During CY18, the deposits have increased by 28.37 percent in comparison
to 54 percent in CY17. Encouragingly, the composition of deposits is tilting
towards individuals who now have 58 percent share in total deposits, while
the institutions account for about 36 percent. The increase in deposits
from individuals has recorded another increase of 23 percent during CY18.
This high growth trend has facilitated in providing a more stable and steady
funding to MFBs.
though
concentration in deposits is still relatively high
The healthy growth in deposits as well as the change
in its composition is encouraging because it is supporting the asset growth.
However, the concentration in deposits of MFBs remains relatively high as
the top 25 depositors constitute around 35 percent of the total deposits.
Despite
some dip in profitability, capital adequacy of MFBs has improved
.
The profitability of the MFBs has observed some
decrease during CY18 despite rise in earning assets. This is mainly due
to increase in provision expense resulting from high defaults in MFBs exposure
to sugar sector. As a result, the profitability indicators have dipped during
CY18 (Table 7.1). The CAR of MFBs has, however, improved by about 1 percentage
point to 22.65 percent in CY18. Injection of fresh capital and rise in retained
earnings and reserves contributed to the improved CAR. (Chart 7.2).
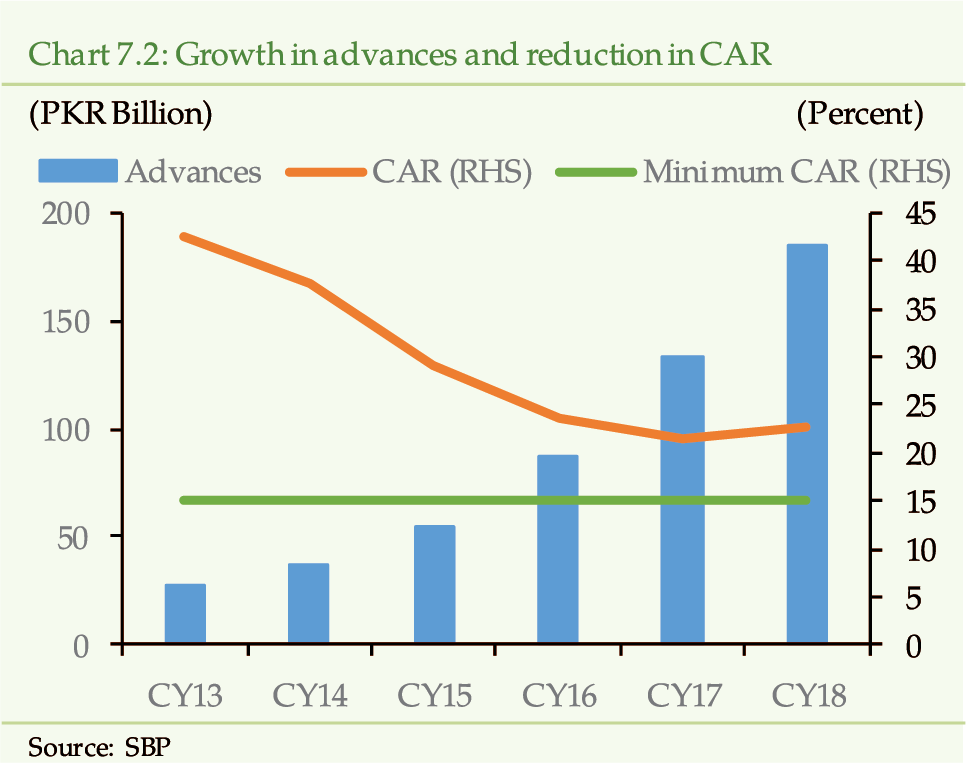
Expansion
in Digital Financial Services (DFS) is changing the financial landscape
With the advancements of new technologies, the
scale of disruption in the banking industry is unprecedented across markets,
distribution channels and product lines. Significant penetration of digital
channels like mobile phone, smart cards, internet, and other technologies
are resulting in new innovative business models that deliver financial services
at lower prices, efficiently and with broader customer reach.
SBP has taken various initiatives in recent past
for promotion of digital payment channels in the country. Some of the measures
include: development of a strong legal and regulatory framework; robust
payment systems infrastructure; Real Time Gross Settlement (RTGS) system;
fully interoperable ATM switches; fast growing internet, mobile and branchless
banking services along with plastic cards (ATM only, Debit, Credit and Pre-Paid
cards). All these initiatives are opening new areas of possibilities in
the Business-to-Business (B2B), Business-to-Customer (B2C), Government-to-Person
(G2P) payments and Person-to-Government (P2G) payments. Because of these
efforts, the share of digital payments is trending upward in Pakistan. (See
Chapter 6). Currently, the share of e-Banking channels i.e. real time
online branches (RTOB), ATMs, e-Commerce, Internet, Mobile Phone and Call
Centers/ IVR Banking in total transactions processed is around 8 percent.
In order to foster innovation in the payments industry
and promote financial inclusion, SBP has issued the regulations for Electronic
Money Institutions.
[4]
Under these regulations, SBP has decided to license non-banking
entities as E-Money Institutions (EMIs). Likewise, an Innovation Challenge
Facility has been launched in May 2019 to facilitate stakeholders to develop
innovative digital solutions
[5]
.
Branchless
Banking, the core of DFS, is continuing its growth momentum
With the advent of Branchless Banking (BB) and
M-wallet accounts, MFBs have gradually leveraged the potential of reaching
to masses without physical outreach through brick and mortar branches. Rapid
outreach and lower operational costs have accelerated the growth of branchless
banking. Especially, the launch of the Asaan Mobile Account (AMA) Scheme
will further enable account opening and usage of financial services through
an interoperable platform for the low income demographic.
[6]
A look at the performance of BB during the CY18 reveals that
the positive momentum of growth in the number of accounts has continued
recording 26.58 percent growth and reaching to 47 million during the year.
Similarly, the BB deposits have grown by 12 percent during the year (Table
7.2).
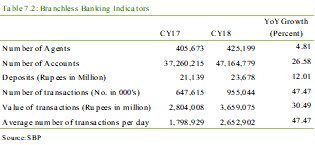
On the usage front, the number of transactions
during the period and the average number of transactions per day have shown
growth of 47 percent and 41 percent, respectively, during CY18.
SBP cognizant of its responsibilities has put in
place a robust risk-based customer due diligence approach to ensure that
the integrity of the branchless banking channels. Based on the category
of account, the Customer Due Diligence (CDD) requirements include verification
of customer particulars from NADRA, biometric verification, transaction
limits and maximum balance limits.
[7]
There
is still untapped potential for the BB players
.
Despite the sustained growth in BB sector there
is still a plenty of untapped potential to expand further the BB services
in the country. Creation of an interoperable digital ecosystem, enhanced
financial literacy, promotion of products and registration of new users,
expanding the value added services in the product offerings are some of
the challenges that BB players need to overcome to maximize true positive
impact of digital financial services.
The
expanding financial inclusion poses limited financial stability concerns
There is growing evidence in the literature that
financial inclusion can have mixed effects on the financial stability of
the system. Some of the positive effects include broadening of banking industrys
assets, diversifying its depositor base and better transmission of monetary
impulses etc.
[8]
On the contrary, risk level may rise from rapid credit
growth associated with new financial inclusion institutions and instruments,
and from inadequate or lack of regulations especially in view of rapid acceleration
in digital financial services.
Since in Pakistan, the strategy for financial inclusion
is supported by a well-defined regulatory and supervisory architecture and
the risk-based customer due diligence (CDD) the negative externalities arising
from the increase in depth and breadth of financial services are limited.
Way
forward
The revised NFIS targets, including the gender
balance, set under the 100-day agenda of the current government require
concerted efforts of all stakeholders. Therefore, there is a need to remain
engaged with them to achieve the common goals.
Box 7: Financial Inclusion
Financial inclusion has
been established as a universal mean to deliver a suite of useful, cost
effective and quality financial services to unbanked individuals and businesses
in order to meet their needs of transactions, savings, payments, credit
and insurance etc. The concept of financial inclusion has evolved over the
time. It goes beyond the simple concept of opening new banking accounts
to having access to a full suite of quality financial services.
Enhancing the breadth and
depth of financial services can significantly contribute in poverty alleviation,
uplifting living standards, reduce income inequality and provide resilience
to absorb financial shocks. Despite the integral part of financial inclusion
in grass root development, majority of people have either no or limited
access to quality financial services especially in developing countries.
In order to reap the aforementioned
benefits, policy makers focus on increasing access, usage and quality of
financial services by providing enabling prudential and legal framework
to the practitioners.
Policymakers to enhance
financial inclusion broadly focus on three key areas i.e. Access, Usage
and Quality.
Access
.
According to Findex database
2017, 1.2 billion people have gotten formal access to a financial account
since 2011. Of this more than half a billion people have gained access in
the last three years.
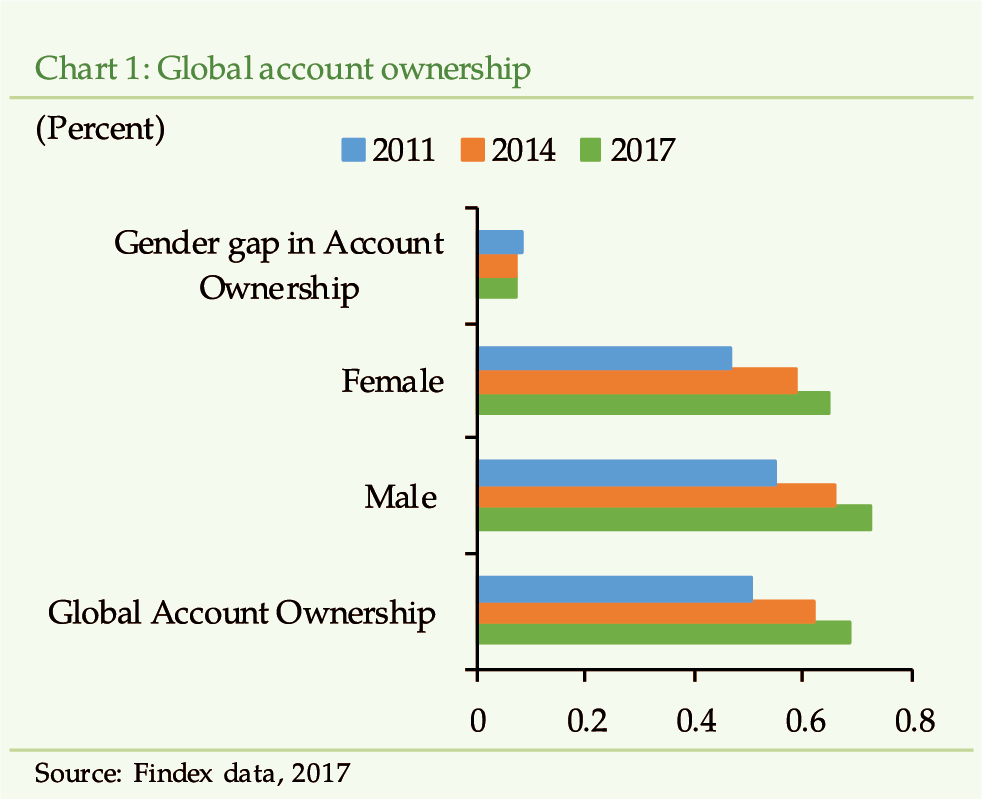
Though there are tangible
gains in financial inclusion over the last few years (Chart 1), however,
almost onethird of the global adult population i.e. 1.7 billion adults,
still do not have a formal bank account.
[1]
The identified reasons for low financial inclusion includes mistrust
of people on financial institutions, capacity and ambition of financial
services provider to reach large scale.
[2]
Access to a basic transaction account is considered
a gateway to broader financial inclusion since it allows people to come
in contact with financial services like sending, receiving and storing of
money. It is more likely that people will use other financial services like
insurance and credit once they become accountholders.
Technology and rapid innovation in digital financial
services have been great drivers of access and inclusion. GSMA calculates
that around 1.3 billion dollars worth transactions are processed through
mobile phones in 90 countries every day.
[3]
The extensive use and capabilities of mobile phones and access
points have transformed the concept from requiring people to physically
accessing financial
institution into brining financial access to their doorsteps.
Usage
A head start on access to financial services is
a good step in the first place, however, it is not enough to
contribute positively to the financial capability of the poor. Using a financial
account is different from only having it. Findex, 2017 data shows that globally
around one-fifth of the accounts remained inactive, no deposit or withdrawal
were made, during the past 12 months. Countries like China, Thailand and
Kenya have expanded their financial access to more than 80 percent. However,
with increased focus on the financial access an even greater focus is needed
on the usage of these accounts.
The introduction and usage of digital technologies
has increased financial inclusion as it lowered the costs of initiating
and maintaining financial relationships for both institutions and consumers.
Overcoming challenges such as digitizing the government to person transfers
and wages can help in improving the access and usage of the accounts.
Quality
Customization and development of financial products
and services to cater to the needs of the poor and the first time users
is another important dimension integral, for improvement in financial inclusion.
Targeting segments like women and poor living in the rural areas with quality
and tailored financial products can augment the access and usage of the
financial inclusion.
Financial capability is the knowing and understanding
of how to use the available financial service that plays an important role
in building a wholesome financial inclusion experience. Products based on
technology ideally should be simple, convenient, reliable, and friendly.
Coupling the provision of quality and customized products with increasing
the financial capability of the customer can lead to better financial inclusion
impacts.
[1]
Global Financial Inclusion (Global Findex) Database.| Data
Catalog, 19 Apr. 2018, datacatalog.worldbank.org/dataset/global-financial-inclusion-global-findex-database.
[2]
Pakistan Enigma: Why Is Financial Inclusion Happening So
Slowly? CGAP, www.cgap.org/blog/pakistan-enigma-why-financial-inclusion-happening-so-slowly.
[3]
State of the Industry Report - Mobile for Development.
Mobile for Development, www.gsma.com/r/state-of-the-industry-report/.
Revision in Financial Sector Vulnerability
Index (FSVI)
FSVI was first introduced in FSR 2016, and since
then it has been modified and regularly published in the subsequent reviews.
The index has been initially developed on yearly basis; however, the frequency
was increased to quarterly basis in FSR 2017. For the current year, few
more modifications have been made in the FSVI in terms of coverage, indicators
and methodology.
In addition to the four areas of risk initially
covered in FSR 2016, the scope of FSVI for 2018 has been enhanced by incorporating
three more sectors. These include Development Finance Institutions (DFIs),
Non-Banking Financial Institutions (NBFIs) and Insurance sector. In addition,
some indicators have been added/removed, to avoid duplication and to improve
risk coverage. See Table 1 below for details.
While the new FSVI continues to be largely based
on the methodology described in Aikman et. al. (2015)
[1]
, few alterations have been made in the aggregation procedure
of the index. Previously, z-scores at aggregate level were scaled between
0 and 1 using the empirical cumulative distribution function (ECDF). This
meant that the highest point, at the aggregate level, were bound to be
ranked 1 (highest risk). As a result, the financial vulnerability could
have been overestimated. To correct this deficiency, the revised methodology
carries out the scaling at indicator level rather than at aggregate level.
The consolidated index is derived by taking simple averages of all the
scaled indicators. The revised methodology ensures that the highest rank
of 1 is assigned only if all of the underlying indicators, simultaneously,
perform at their worst levels.
Moreover, the revised methodology makes the results
of FSVI consistent with other composite indicators, such as the Banking
Sector Stability Map (BSSM), used in the FSR.


| AEs |
Advances Economies |
| A/E |
Asset-Equity Ratio |
| AC&MFD |
Agricultural Credit & Microfinance
Department |
| ADD |
Authorized Derivative Dealer |
| ADR |
Advances to Deposit Ratio |
| AEs |
Advanced Economies |
| AFS |
Available-For-Sale |
| AMA |
Asaan Mobile Account |
| AMCs |
Asset Management Companies |
| AML |
Anti Money Laundering |
| APG |
Asia-Pacific Group on Money Laundering |
| ATM |
Automated Teller Machines |
| AUMs |
Assets Under Management |
| Av. |
Average |
| B2B |
Business-to-Business |
| B2C |
Business-to-Customer |
| BB |
Branchless Banking |
| BC&CPD |
Banking Conduct & Consumer Protection
Department |
| BCBS |
Basel Committee on Banking Supervision |
| BCO, 1962 |
Banking Companies Ordinance, 1962 |
| BIA |
Basic Indicator Approach |
| BIS |
Bank for International Settlements |
| BISP |
Benazir Income Support Program |
| BoD |
Board of Directors |
| BoE |
Bank of England |
| BOP |
Balance of Payment |
| BPRD |
Banking Policy and Regulations Department |
| bps |
Basis Points |
| BSSM |
Banking Sector Stability Map |
| BTF |
Balance Transfer Facility |
| CAELS |
Capital Adequacy, Asset Quality,
Earnings, Liquidity, Sensitivity |
| CAGR |
Compound average growth rate |
| CAPTCHA |
Completely Automated Public Turing
test to tell Computers and Humans Apart |
| CAR |
Capital Adequacy Ratio |
| CASA |
Current Account Savings Account |
| CBCG |
Correspondent Banking Coordination
Group |
| CBCM |
Cross Border Currency Movement |
| CCP |
Central Counter Party |
| CCS |
Cross Currency Swaps |
| CDC |
Central Depository Company |
| CDD |
Customer Due Diligence |
| CDNS |
Central Directorate of National Savings |
| CDS |
Central Depository System |
| CDS |
Currency Declaration Systems |
| CE |
Capital Employed |
| CES |
Centralized e-IPO System |
| CF |
Consumer Finance |
| CFT |
Combating the Financing of Terrorism |
| CGHM |
Consumer Grievances Handling Mechanism
|
| CME |
Chicago Mercantile Exchange |
| CNP |
Card-not-Present |
| CNY |
Chinese Yuan |
| CoDs |
Certificate of Deposits |
| COIs |
Certificate of Investments |
| CoR |
Council of Regulators |
| CPEC |
China-Pakistan Economic Corridor |
| CPI |
Consumer Price Index |
| CPMI |
Committee for Payments and Market
Infrastructure |
| CRI |
Climate Risk Index |
| CRR |
Cash Reserve Requirement |
| CRWAs |
Credit Risk Weighted Assets |
| CS |
Consolidated Supervision |
| CSD |
Central Securities Depository |
| CSPs |
Card Service Providers |
| CTAR |
Capital to Total Assets Ratio |
| CTR |
Currency Transactions Reports |
| CY |
Calendar Year |
| DB |
Defined Benefit |
| DC |
Defined Contribution |
| DFIs |
Development Finance Institutions |
| DMMD |
Domestic Markets & Monetary Management
Department |
| DNFBPs |
Designated non-financial business
and professions |
| DNS |
Deferred Net Settlement |
| DPC |
Deposit Protection Corporation |
| D-SIBs |
Domestic Systemically Important Banks |
| DTRS |
Derivative Transactions Reporting
System |
| e-banking |
Electronic Banking |
| EBIT |
Earnings before interest and taxes |
| ebitta |
Earnings Before Interest and Taxes
to Total Assets |
| EC |
Exchange Company |
| ECA |
Full-fledged Exchange Company |
| ECAIS |
External Credit Assessment Institutions
|
| ECB |
B Category Exchange Company |
| ECDF |
Empirical Cumulative Distribution
Function |
| e-CIB |
Electronic Credit Information Bureau |
| EFT |
Electronic Fund Transfer |
| EM |
Executive Management |
| EMDEs |
Emerging Market and Developing Economies |
| EMEs |
Emerging Market Economies |
| EMI |
E-Money Institution |
| EMV |
Europay, Mastercard and Visa |
| EMWA |
Exponential Moving Weighted Average
|
| EOBI |
Employees Oldage Benefit Institute |
| EPD |
Exchange Policy Department |
| EPU |
Economic Policy Uncertainty Index |
| eqtyta |
Equity to Total Assets |
| ER |
Exchange Rate |
| EU |
European Union |
| EWIs |
Early Warning Indicators |
| EWMA |
Exponential Moving Weighted Average |
| FATF |
Financial Action Task Force |
| FBR |
Federal Board of Revenue |
| FCY |
Foreign Currency |
| FDBR |
Financial Derivative Business Regulations |
| FDI |
Foreign Direct Investment |
| FEM |
Fixed Effect Model |
| FERA |
Foreign Exchange Regulations Act ,
1947 |
| FFSAP |
Financing Facility for Storage of
Agriculture Produce |
| FIRA, 2016 |
Financial Institutions (Recovery
of Finances) Amendment Act, 2016 |
| FIs |
Financial Institutions |
| FMI |
Financial Market Infrastructure |
| FMU |
Financial Monitoring Unit |
| FoF |
Fund of Funds |
| FRA |
Forward Rate Agreement |
| FSB |
Financial Stability Board |
| FSD |
Financial Stability Department |
| FSEC |
Financial Stability Executive Committee
|
| FSHM |
Financial Sector Heat Map |
| FSI |
Financial Soundness Indicators |
| FSR |
Financial Stability Review |
| FSRB |
FATF-Style Regional Body |
| FSVI |
Financial Sector Vulnerability Index
|
| FX |
Foreign Exchange |
| FY |
Financial Year |
| FY |
Fiscal Year |
| G2P |
Government-to-Person |
| GARP |
Global Association of Risk Professionals |
| GBP |
Great British Pound |
| GCC |
Gulf Cooperation Council |
| GDP |
Gross Domestic Product |
| GEPU |
Global Economic Policy Uncertainty |
| GFC |
Global Financial Crisis |
| GIFR |
Global Islamic Finance Report |
| GNPLR |
Gross Non-Performing Loans Ratio |
| GoP |
Government of Pakistan |
| GP |
General Partner |
| GPR |
Geopolitical Risk Index |
| G-SIBs |
Global Systemically Important Banks |
| H2 |
Second Half of Calendar Year |
| HFT |
Held-For-Trading |
| HHI |
Herfindahl-Hirschman Index |
| HIF |
Health Insurance Fund |
| HP Filter |
Hodrick-Prescott Filter |
| HRA |
Home Remittance Account |
| I&I Inland Revenue |
Intelligence and Investigation - Inland
Revenue |
| IAs |
Investment Advisors |
| IB |
Islamic Bank |
| IBAN |
International Bank Account Number |
| IBD |
Islamic Banking Department |
| IBFT |
Inter Bank Fund Transfer |
| IBIs |
Islamic Banking Institutions |
| ICE |
Inter Continental Exchange |
| ICO |
Initial Coin Offering |
| ICR |
Interest Coverage Ratio |
| ICRG |
FATFs International Cooperation Review
Group |
| IFCs |
Investment Finance Companies |
| IFIs |
Islamic financial institutions |
| IFSB |
Islamic Financial Services Board |
| IFSI |
Islamic Financial Services Industry |
| IFT |
Interbank Fund Transfers |
| IGC |
International Growth Centre |
| IH&SMEFD |
Infrastructure, Housing & SME
Finance Department |
| ILF |
Investment-Linked Fund |
| ILF |
Intra-Day Liquidity Facility |
| ILTFF |
Islamic Long Term Financing Facility |
| IMF |
International Monetary Fund |
| IOSCO |
International Organization of Securities
Commissions |
| IPO |
Initial Public Offering |
| IRR |
Internal Rate of Return |
| IRR |
Interest Rate Risk |
| IRS |
Interest Rates Swaps |
| IRSA |
Indus River Systems Authority |
| IT |
Information Technology |
| JTF |
Joint Task Force |
| KIBOR |
Karachi Inter-Bank Offered Rate |
| KMI |
Karachi Meezan Index |
| KPK |
Khyber Pakhtunkhwa |
| KSE |
Karachi Stock Exchange |
| KYC |
Know Your Customer |
| LBO |
Leveraged Buyout |
| LEAs |
Law Enforcement Agencies |
| LHS |
Left Hand Side |
| LOU |
Letter of Understanding |
| LP |
Limited Partner |
| LSM |
Large Scale Manufacturing |
| LTA |
Look-Through Approach |
| LTFF |
Long Term Financing Facility |
| LTL |
Long-Term Liability |
| LVPS |
Large Value Payment Systems |
| M&A |
Merger and Acquisition |
| MCR |
Minimum Capital Requirement |
| MENA |
Middle East and North Africa |
| MENAP |
Middle-East, North Africa, Afghanistan
and Pakistan |
| MER |
Mutual Evaluation Report |
| MFBs |
Microfinance Banks |
| MFS |
Margin Financing Scheme |
| ML/TF |
Money Laundering/Terrorist Financing |
| MMCs |
Modaraba Management Companies |
| MMFs |
Money Market Funds |
| MNSBs |
Multilateral Net Settlement Batches |
| MoF |
Ministry of Finance |
| MOU |
Memorandum of Understanding |
| MPS |
Micro-Prudential Supervision |
| MRWA |
Market Risk Weighted Assets |
| MSCI |
Morgan Stanley Capital International |
| MSCI EM |
Morgan Stanley Capital International
Emerging Markets |
| MTBs |
Market Treasury Bills |
| MTM |
Mark to Market |
| MTO |
Money Transfer Operator |
| MTS |
Margin Trading Scheme |
| MUFAP |
Mutual Funds Association of Pakistan |
| MVTS |
Money or Value Transfer Services |
| M-wallet |
Mobile Wallet |
| NA |
Not Applicable |
| NADRA |
National Database and Registration
Authority |
| NAFTA |
North American Free Trade Agreement |
| NAV |
Net Asset Value |
| NBFCs |
Non-Banking Finance Companies |
| NBFIs |
Non-Bank Financial Institutions |
| NBMFCs |
Non-bank Microfinance Companies |
| NCCPL |
National Clearing Company of Pakistan
Limited |
| NCDF |
Normal Cumulative Distribution Function |
| NCSS |
National Clearing and Settlement System |
| NFA |
Net Foreign Assets |
| NFAS |
Non-Financial Advisory Services |
| NFCI |
National Financial Conditions Index
|
| NFF |
Non-Financial Firms |
| NFIS |
National Financial Inclusion Strategy |
| NFLP |
National Financial Literacy Program
|
| NFSC |
National Financial Stability Council |
| NGOs |
Non-Governmental Organization |
| NI |
Net Income |
| NIFT |
National Institutional Facilitation
Technologies (Pvt.) Limited |
| NII |
Net Interest Income |
| NIM |
Net Interest Margin |
| NMI |
Non Market Maker Financial Institutions
|
| NPF |
Non-performing Financing |
| NPLR |
Non-Performing Loan Ratio |
| NPLs |
Non-Performing Loans |
| NR3C |
National Response Center for Cyber
Crime |
| NRA |
National Risk Assessment |
| NSS |
National Savings Schemes |
| O/N |
Overnight Rate |
| OBOR |
One Belt One Road |
| OD |
Overdue |
| OECD |
Organization for Economic Co-operation
and Development |
| OL |
Ordinary Life |
| OMOs |
Open Market Operations |
| OPEC |
Organization of the Petroleum Exporting
Countries |
| ORWAs |
Operational Risks Weighted Assets |
| OTC |
Over The Counter |
| P/E |
Price-Earning Ratio |
| P2G |
Person-to-Government |
| PAMA |
Pakistan Automotive Manufacturers
Association |
| PBA |
Pakistan Banks Association |
| PBIT |
Profit Before Interest and Taxes |
| PBT |
Profit Before Tax |
| PD |
Product Development |
| PDs |
Probabilities of Default |
| PE |
Private Equity |
| PE&VC |
Private Equity and Venture Capital
|
| PFMI |
Principles for Financial Market Infrastructures |
| PIBs |
Pakistan Investment Bonds |
| PIPE |
Private Investment in Public Companies |
| PKR |
Pakistani Rupee |
| PMEX |
Pakistan Mercantile Exchange Limited |
| PMIC |
Pakistan Microfinance Investment Companies |
| PMRC |
Pakistan Mortgage Refinance Company
|
| PO |
Pecking Order Theory |
| PORs |
PRISM Operating Rules |
| POS |
Point Of Sale |
| PPAP |
Pakistan Poverty Alleviation Fund |
| PRI |
Pakistan Remittance Initiative |
| PRISM |
Pakistan Real-Time Interbank Settlement |
| PRs |
Prudential Regulations |
| PSA |
Private Sector Advances |
| PSD |
Payment Systems Department |
| PSDP |
Public Sector Development Programme |
| PSEFT |
Payment Systems And Electronic Fund
Transfer |
| PSEs |
Public Sector Entities |
| PSO |
Payment System Operator |
| PSP |
Payment Service Provider |
| PSX |
Pakistan Stock Exchange |
| QE |
Quantitative Easing |
| REER |
Real Effective Exchange Rate |
| REIT |
Real Estate Investment Trust |
| retta |
Retained Earnings to Total Assets |
| RHS |
Right Hand Side |
| RMCs |
REIT Management Companies |
| RO |
Representative Offices |
| ROA |
Return on Assets |
| ROI |
Return on Investment |
| RSPs |
Rural Support Programs |
| RTF |
Remittance Task Force |
| RTGS |
Real Time Gross Settlement |
| RTOB |
Real Time Online Branches |
| RTOB |
Real Time Online Banking |
| RVPS |
Retail Value Payment Systems |
| S&A |
Subsidiaries and Associated Undertakings |
| S&DWH |
Statistics & Data Warehouse Department |
| S&P |
Standard & Poors |
| S&P GSCI |
Standard and Poor Goldman Sachs Commodity
Index |
| SAARC |
The South Asian Association for Regional
Cooperation |
| salesta |
Sales to Total Assets |
| SB |
Shariah Board |
| SBP |
State Bank of Pakistan |
| SCD |
Shariah Compliance Department |
| SCRA |
Special Convertible Rupee Account |
| SEANZA |
South East Asia, New Zealand, Australia
Forum |
| SECP |
Securities and Exchange Commission
of Pakistan |
| SECP |
Securities & Exchange Commission
of Pakistan |
| SGF |
Settlement Guarantee Fund |
| SIPs |
Systemically Important Payment Systems |
| SLB |
Securities Lending and Borrowing |
| SLR |
Statutory Liquidity Requirement |
| SMEs |
Small & Medium Enterprises |
| SRS |
Systemic Risk Survey |
| SSS |
Securities Settlement System |
| STRs |
Suspicious Transactions Report |
| sVaR |
Stressed Value at Risk |
| SWIFT |
Society For Worldwide Interbank Financial
Telecommunication |
| TA |
Technical Assistance |
| T-Bill |
Treasury Bills |
| TDR |
Term Deposit Receipt |
| TF |
Terrorism Financing |
| TFC |
Term Finance Certificate |
| TFS |
Targeted Financial Sanctions |
| TO |
Trade-Off Theory |
| TRWAs |
Total Risk Weighted Assets |
| UAE |
United Arab Emirates |
| UK |
United Kingdom |
| UNSC |
United Nations Security Council
|
| US |
Unites States |
| USD |
US Dollar |
| VaR |
Value at Risk |
| VC |
Venture Capital |
| VPS |
Voluntary Pension Scheme |
| WADR |
Weighted Average Deposit Rate |
| WALR |
Weighted Average Lending Rate |
| wcta |
Working Capital to Total Assets |
| WEO |
World Economic Outlook |
| WHRF |
Warehouse Receipt Financing |
| WMP |
wealth-management-product |
| WTOs |
Window Takaful Operators |
| WWF |
Workers Welfare Fund |
| YoY |
Year on Year |
| YTD |
Year To Date |